. 2003 Oct 1;22(19):5003-14.
doi: 10.1093/emboj/cdg517.

SseG, a virulence protein that targets Salmonella to the Golgi network

Affiliations

SseG, a virulence protein that targets Salmonella to the Golgi network

Suzana P Salcedo et al. EMBO J. .

Abstract

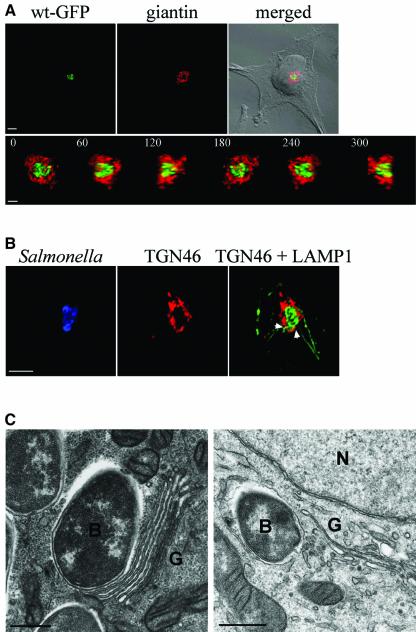
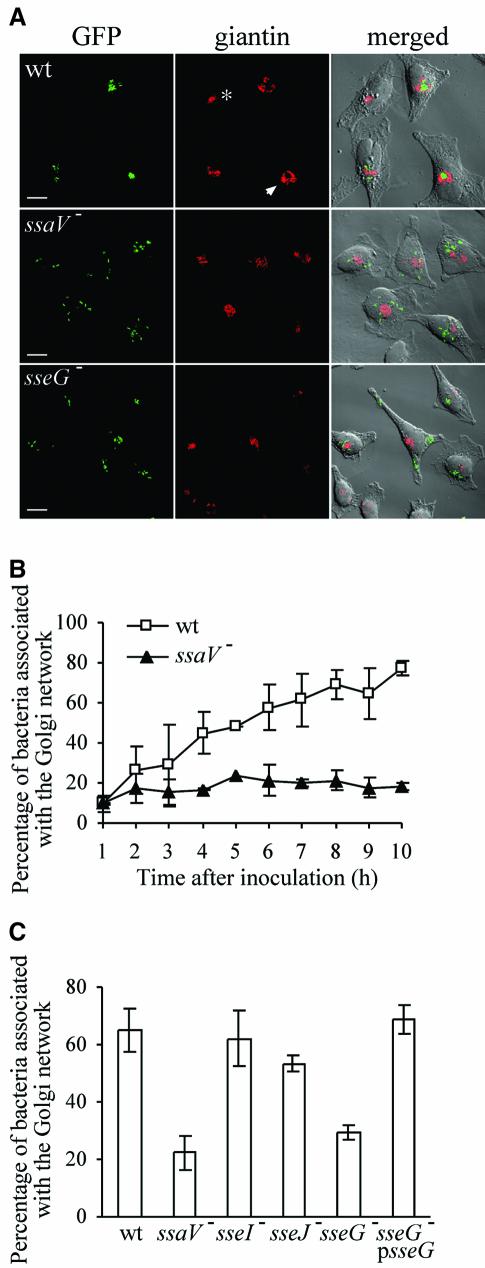
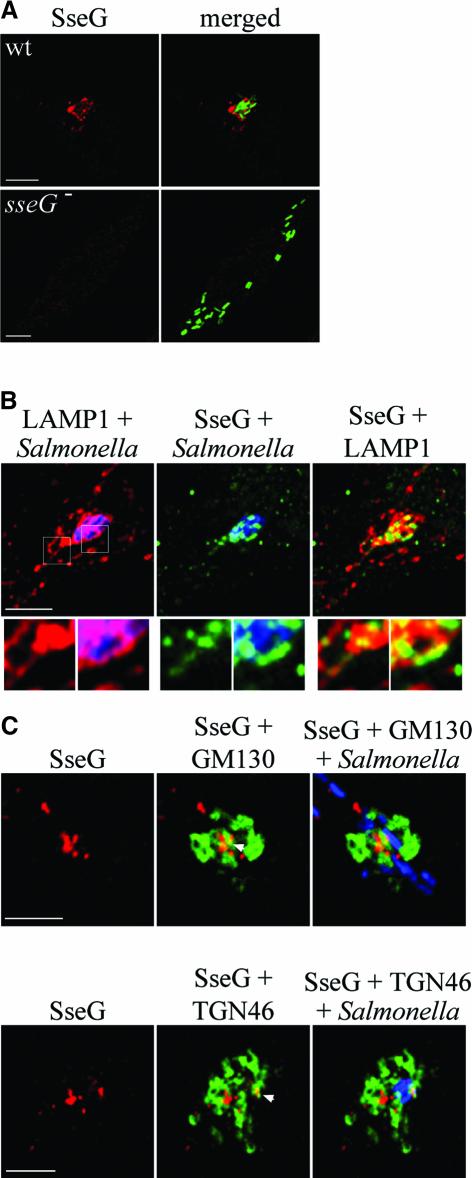
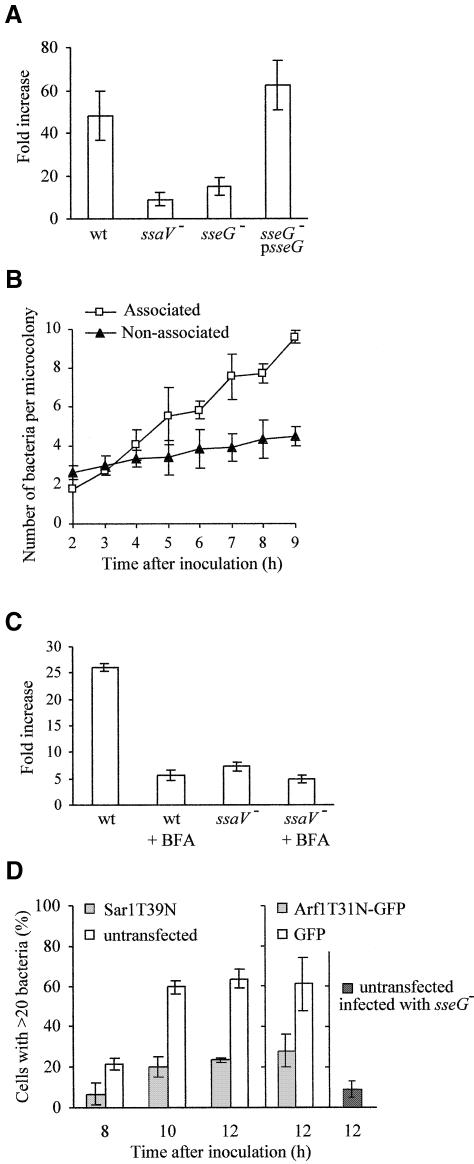
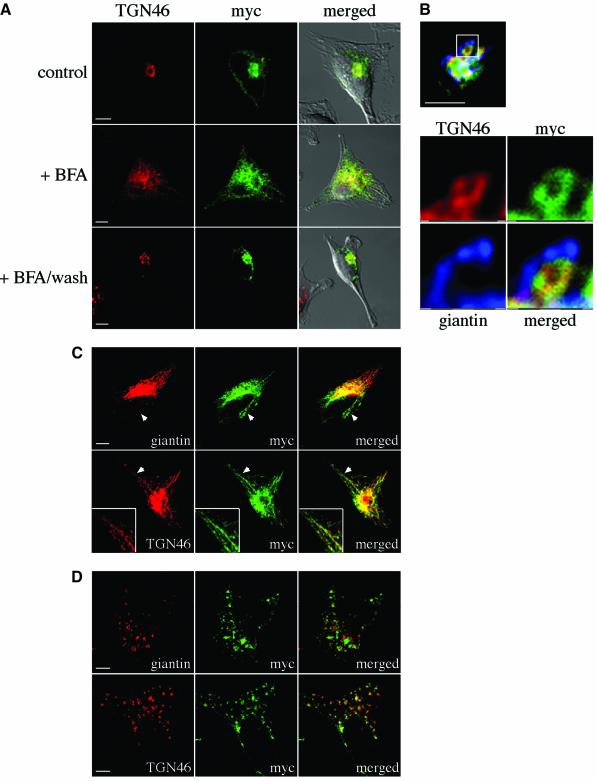
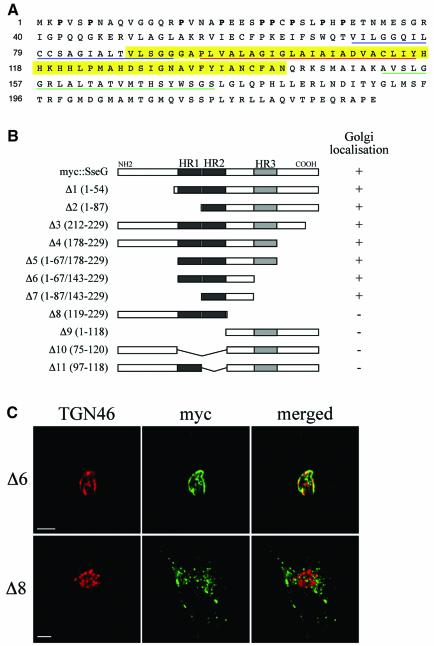
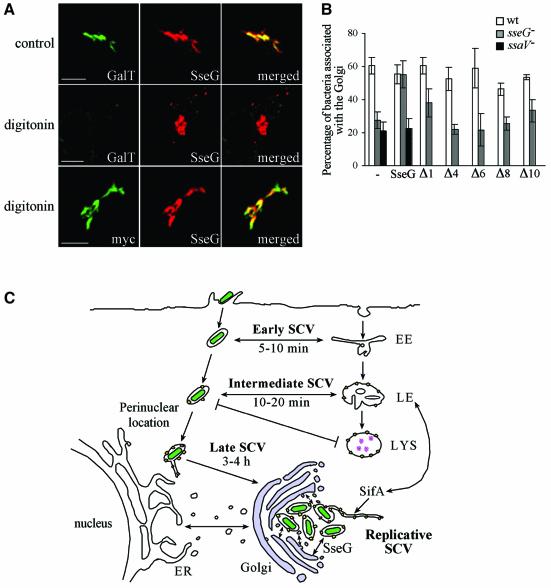
Intracellular replication of the bacterial pathogen Salmonella enterica occurs in membrane-bound compartments called Salmonella-containing vacuoles (SCVs). Maturation of the SCV has been shown to occur by selective interactions with the endocytic pathway. We show here that after invasion of epithelial cells and migration to a perinuclear location, the majority of SCVs become surrounded by membranes of the Golgi network. This process is dependent on the Salmonella pathogenicity island 2 type III secretion system effector SseG. In infected cells, SseG was associated with the SCV and peripheral punctate structures. Only bacterial cells closely associated with the Golgi network were able to multiply; furthermore, mutation of sseG or disruption of the Golgi network inhibited intracellular bacterial growth. When expressed in epithelial cells, SseG co-localized extensively with markers of the trans-Golgi network. We identify a Golgi-targeting domain within SseG, and other regions of the protein that are required for localization of bacteria to the Golgi network. Therefore, replication of Salmonella in epithelial cells is dependent on simultaneous and selective interactions with both endocytic and secretory pathways.


Figures

None
Fig. 1. Salmonella associates with the Golgi network in HeLa cells. (A) Upper panel, confocal immunofluorescence micrograph showing the subcellular localization of GFP-expressing wild-type S.typhimurium (wt-GFP, green) in relation to the cis-Golgi protein giantin (red), and the host cell (DIC in merged image), 8 h after invasion. Scale bar corresponds to 5 µm. Lower panel shows a 360° rotation on the y-axis of a 3D reconstruction obtained from a z-stack of the cell shown in the upper panel. Scale bar corresponds to 2 µm. (B) Infected cells were labelled for TGN46 (red), Salmonella (blue) and LAMP1, a marker of the SCV membrane (green). Points of co-localization between LAMP1 and TGN46 are indicated by arrowheads. Scale bar corresponds to 5 µm. (C) Transmission electron micrographs of representative HeLa cells showing wild-type Salmonella (B) in close proximity to Golgi cisternae (G). The nucleus is marked as (N). Scale bars correspond to 500 nm.
None
Fig. 2. Salmonella–Golgi association requires the SPI-2 TTSS effector protein SseG. (A) Intracellular distribution of GFP-expressing wild-type (wt), ssaV or sseG mutant strains in relation to giantin, 8 h after invasion of HeLa cells. Arrowhead indicates a distorted Golgi structure associated with a bacterial microcolony. Asterisk indicates compact Golgi network in an uninfected cell. Scale bars correspond to 10 µm. (B) Time course showing the increased association of wild-type S.typhimurium with the Golgi network (revealed by giantin labelling) in contrast to the ssaV mutant strain. Standard deviations from the mean are shown; results correspond to three independent experiments. (C) Association of SPI-2 effector mutant strains with the Golgi, 8 h after invasion of HeLa cells. Standard deviations from the mean are shown; results correspond to three independent experiments.
None
Fig. 3. Intracellular distribution of SseG in HeLa cells. (A) Confocal immunofluorescence microscopy of HeLa cells infected for 10 h by GFP-expressing wild-type strain or the sseG mutant as a control. Cells were labelled with the anti-SseG antibody (red). Scale bars correspond to 5 µm. (B) Confocal immunofluorescence microscopy of HeLa cells infected for 10 h by wild-type S.typhimurium. Boxed areas shown in higher magnification below show co-localization between SseG (green) and LAMP1 (red) on a Sif and SCV membrane. Salmonella typhimurium was labelled with an anti-Salmonella antibody (blue). Punctate labelling of SseG can also be seen in the vicinity of the microcolony. Scale bar corresponds to 5 µm. (C) Distribution of SseG in relation to the Golgi network in HeLa cells infected for 10 h with wild-type bacteria (blue in merged image). Arrowheads indicate points of co-localization between SseG (red) and either GM130 (green, upper panel) or TGN46 (green, lower panel). Scale bars correspond to 5 µm.
None
Fig. 4. Interaction of Salmonella with the Golgi network is required for intracellular replication in HeLa cells. (A) Intracellular replication of S.typhimurium strains in HeLa cells. The values shown are representative of three independent experiments and indicate the fold increase calculated as a ratio of the intracellular bacteria between 16 and 2 h after invasion. Each infection was performed in triplicate and the standard errors from the mean are shown. (B) Analysis of the number of bacteria per microcolony in HeLa cells during a 9 h time course. Microcolonies associated with the Golgi network are compared with those found elsewhere in the cell. Values represent the mean of three independent experiments and the standard deviations from the mean are shown. (C) Intracellular replication of S.typhimurium strains in HeLa cells treated with BFA. The assay was carried out as for (A) above, except that BFA (5 µg/ml) was added at 15 min after invasion. There was no statistical difference between the numbers of internalized bacteria in treated or untreated cells at the 2 h time point. (D) Effect of expression of SarT39N or ArfT31N on intracellular replication of wild-type S.typhimurium. HeLa cells were transfected for 14 h, then infected for a further 8–12 h. Values represent the percentage of host cells containing more than 20 bacteria at different time points after invasion. The percentage of untransfected cells with more than 20 sseG mutant bacteria is shown on the right. Values represent the means of three independent experiments and the standard deviations from the mean are shown.
None
Fig. 5. Expression of myc::SseG in HeLa cells results in its localization to the Golgi network. (A) Cells expressing a myc-tagged version of SseG (green) were co-labelled with an antibody against TGN46 (red), and examined by confocal microscopy. The majority of myc::SseG co-localizes with TGN46 (upper panel) and its redistribution follows that of the TGN marker upon BFA treatment (middle panel). BFA washout leads to recovery of a compact Golgi structure, and the re-localization of myc::SseG (lower panel). Scale bars correspond to 5 µm. (B) Cells expressing myc::SseG (green) were triple labelled with anti-myc (green), anti-TGN46 (red) and anti-giantin (blue) antibodies. (C) Cells expressing myc::SseG (green) were treated with BFA for 10 min, fixed and labelled with either anti-giantin or anti-TGN46 antibodies. In the upper panel the arrowheads indicate tubules containing myc::SseG (green) which does not co-localize with giantin (red). Scale bar corresponds to 5 µm. In the lower panel, myc::SseG co-localizes with TGN46 in tubules. Arrowheads indicate tubulating regions shown at a higher magnification in insets. (D) Distribution of myc::SseG and Golgi markers after exposure of transfected cells to nocodazole. Cells were labelled with anti-myc (green) and either anti-giantin (red, upper panel) or anti-TGN46 (red, lower panel) antibodies. Scale bars correspond to 5 µm.
None
Fig. 6. Identification of Golgi-targeting regions of SseG. (A) Amino acid sequence of SseG. Hydrophobic regions HR1, HR2 and HR3 are underlined in blue, red and green, respectively. The Golgi targeting region is highlighted in yellow. Prolines in the N-terminal 31 amino acids are in bold. (B) Schematic representation of truncated polypeptides derived from myc::SseG. The extent of each deletion is shown in parentheses to the left of each construct. The ability of each polypeptide to associate with the Golgi is indicated to the right of each construct. (C) Representative images of Δ6 (upper panel) showing extensive co-localization with TGN46 and Δ8 (lower panel) showing a scattered distribution, with no co-localization with the Golgi marker. Scale bars correspond to 5 µm.
None
Fig. 7. Topology of SseG and functional activity of mutant polypeptides. (A) HeLa cells expressing myc::SseG were permeabilized with Triton X-100 (control) or digitonin and labelled with antibodies against myc, SseG or a luminal epitope of human galactosyltransferase (GalT). Scale bars correspond to 5 µm. (B) HeLa cells expressing wild-type or mutant myc::SseG polypeptides were infected for 10 h with GFP-expressing wild-type, ssaV or sseG mutant S.typhimurium. Cells were labelled with anti-myc and anti-giantin antibodies, and the level of bacterial association with the Golgi network was determined in both transfected and untransfected cells. Values represent means of three independent experiments and the standard deviations from the mean are shown. (C) Model of SCV trafficking in relation to localization within epithelial cells. Following host cell invasion, development of the early and intermediate SCV proceeds by progressive and selective interactions with compartments of the endocytic pathway (LAMP1 and cathepsin D are shown as yellow and pink symbols, respectively), as bacteria (green) migrate to a perinuclear location. This leads to the formation of the late SCV. The translocation of the SPI-2 TTSS effector SifA is required for recruitment of lgp-containing vesicles and the formation of Sifs, while SseG localizes SCVs to the Golgi network. As a consequence of this, the replicative phase of development can begin through acquisition of nutrients that enable bacterial replication, and membrane which encloses the growing population of intracellular bacteria. EE, early endosome; LE, late endosome; LYS, lysosome.

References

    1. Berger E.G., Aegerter,E., Mandel,T. and Hauri,H.P. (1986) Monoclonal antibodies to soluble, human milk galactosyltransferase (lactose synthase A protein). Carbohydr. Res., 149, 23–33. - PubMed
    1. Beuzón C.R., Méresse,S., Unsworth,K.E., Ruiz-Albert,J., Garvis,S., Waterman,S.R., Ryder,T.A., Boucrot,E. and Holden,D.W. (2000) Salmonella maintains the integrity of its intracellular vacuole through the action of SifA. EMBO J., 19, 3235–3249. - PMC - PubMed
    1. Beuzón C.R., Salcedo,S.P. and Holden,D.W. (2002) Growth and killing of a Salmonella enterica serovar Typhimurium sifA mutant strain in the cytosol of different host cell lines. Microbiology, 148, 2705–2715. - PubMed
    1. Bispham J., Tripathi,B.N., Watson,P.R. and Wallis,T.S. (2001) Salmonella pathogenicity island 2 influences both systemic salmonellosis and Salmonella-induced enteritis in calves. Infect. Immun., 69, 367–377. - PMC - PubMed
    1. Brumell J.H., Tang,P., Mills,S.D. and Finlay,B.B. (2001) Characterization of Salmonella-induced filaments (Sifs) reveals a delayed interaction between Salmonella-containing vacuoles and late endocytic compartments. Traffic, 2, 643–653. - PubMed

Publication types

Substances