. 2003 Oct;14(10):4272-84.
doi: 10.1091/mbc.e03-01-0042. Epub 2003 Jun 27.

Amino acid starvation and Gcn4p regulate adhesive growth and FLO11 gene expression in Saccharomyces cerevisiae

Affiliations

Amino acid starvation and Gcn4p regulate adhesive growth and FLO11 gene expression in Saccharomyces cerevisiae

Gerhard H Braus et al. Mol Biol Cell. 2003 Oct.

Abstract

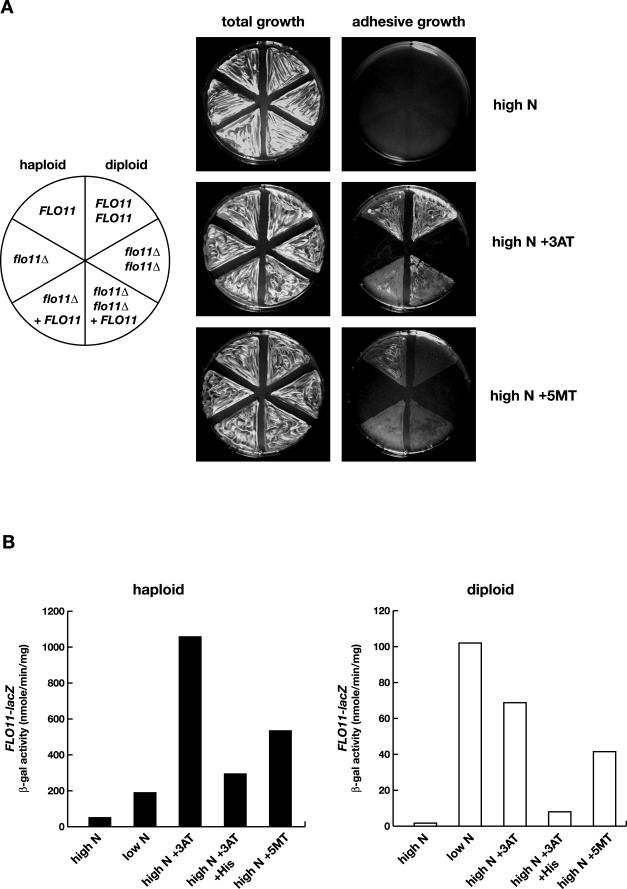
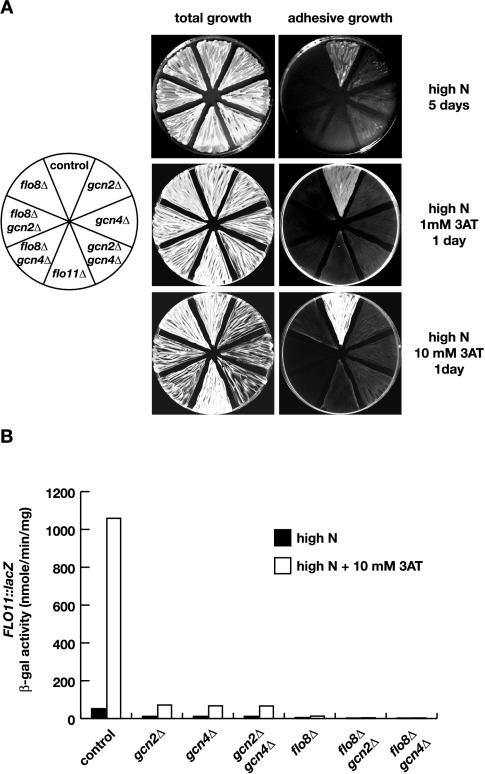
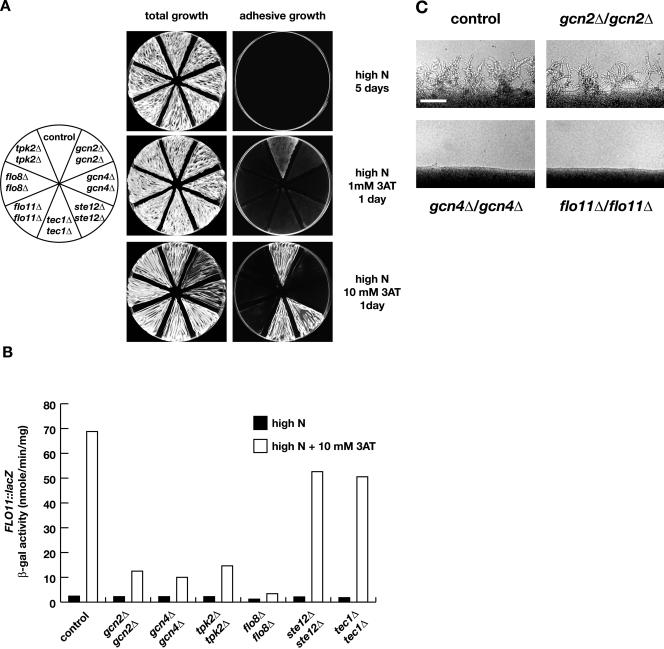
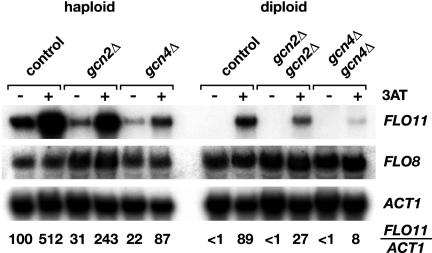
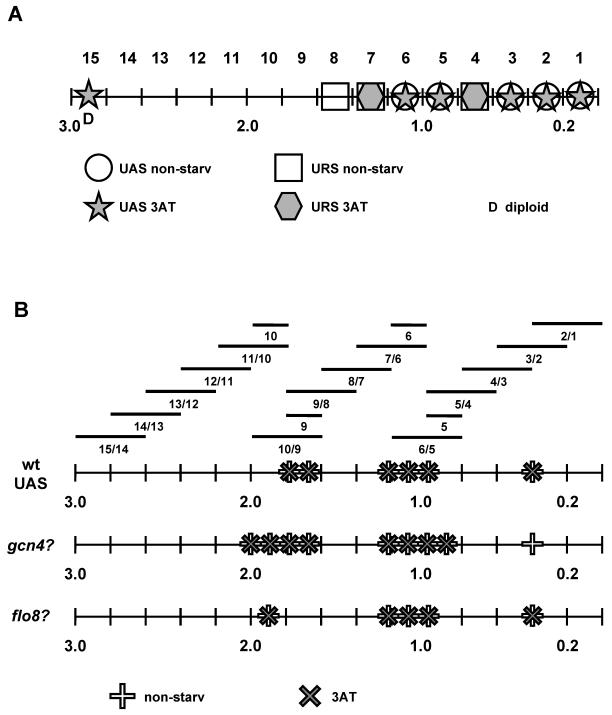
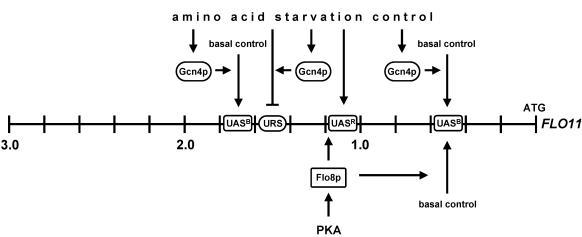
In baker's yeast Saccharomyces cerevisiae, cell-cell and cell-surface adhesion are required for haploid invasive growth and diploid pseudohyphal development. These morphogenetic events are induced by starvation for glucose or nitrogen and require the cell surface protein Flo11p. We show that amino acid starvation is a nutritional signal that activates adhesive growth and expression of FLO11 in both haploid and diploid strains in the presence of glucose and ammonium, known suppressors of adhesion. Starvation-induced adhesive growth requires Flo11p and is under control of Gcn2p and Gcn4p, elements of the general amino acid control system. Tpk2p and Flo8p, elements of the cAMP pathway, are also required for activation but not Ste12p and Tec1p, known targets of the mitogen-activated protein kinase cascade. Promoter analysis of FLO11 identifies one upstream activation sequence (UASR) and one repression site (URS) that confer regulation by amino acid starvation. Gcn4p is not required for regulation of the UASR by amino acid starvation, but seems to be indirectly required to overcome the negative effects of the URS on FLO11 transcription. In addition, Gcn4p controls expression of FLO11 by affecting two basal upstream activation sequences (UASB). In summary, our study suggests that amino acid starvation is a nutritional signal that triggers a Gcn4p-controlled signaling pathway, which relieves repression of FLO11 gene expression and induces adhesive growth.


Figures

Figure 1.
Figure 1.
Amino acid starvation induces adhesive growth and FLO11 expression in haploid and diploid S. cereivisiae strains. (A) Haploid strains RH2648 (FLO11) and RH2662 (flo11Δ), and diploid strains RH2656 (FLO11/FLO11) and RH2661 (flo11Δ/flo11Δ) carrying plasmid B3782 or pME2519 (+FLO11) were patched on YNB (high N), YNB + 5 mM 3AT (high N + 3AT) or YNB + 1 mM 5MT (high N + 5MT). Plates were incubated at 30°C for 24 h and photographed before (total growth) and after (adhesive growth) nonadhesive yeast cells were washed off the agar surface. (B) Expression of the FLO11-lacZ reporter gene was determined in yeast strains RH2648 (haploid) and RH2656 (haploid) carrying plasmid B3782 under different nutritional conditions. Cultures grown in YNB were used for assaying high ammonium conditions (high N, 50 mM ammonium sulfate). Nitrogen starvation (low N) was induced by growth in YNB with limited amounts of ammonium sulfate (50 μM) as sole nitrogen source. Amino acid starvation was induced by addition of 10 mM 3AT (high N + 3AT) or 1 mM 5MT (high N + 5MT). To revert histidine starvation, 1 mM histidine was added to YNB medium containing 10 mM 3AT (high N + 3AT +His). Units of specific β-galactosidase activities are shown in nanomoles per minute per milligram. Bars depict means of at least three independent measurements with a SD not exceeding 15%.
Figure 3.
Figure 3.
Requirement of GCN2, GCN4, and FLO8 for amino acid starvation-induced adhesive growth and FLO11 expression in haploid S. cerevisiae strains. (A) Haploid yeast strains RH2648 (control), RH2649 (gcn2Δ), RH2650 (gcn4Δ), RH2651 (gcn2Δ gcn4Δ), RH2662 (flo11Δ), RH2652 (flo8Δ), RH2653 (flo8Δ gcn2Δ) and RH2654 (flo8Δ gcn4Δ) carrying plasmid B3782 were patched on YNB +Arg medium (high N) and on YNB + Arg containing either 1 mM 3AT (high N + 1 mM 3AT) or 10 mM 3AT (high N + 10 mM 3AT). Plates were incubated at 30°C for 1 d (3AT-containing media) or 5 d (nonstarvation medium) and photographed before (total growth) and after (adhesive growth) nonadhesive cells were washed off the agar surface. (B) Expression of FLO11-lacZ. Strains used in A were grown to logarithmic phase in YNB +Arg medium (high N) or YNB +Arg medium containing 10 mM 3AT (high N + 10 mM 3AT) before specific β-galactosidase activities were measured. Bars depict means of at least three independent measurements of β-galactosidase activities with a SD not exceeding 15%. Units are nanomoles per minute per milligram.
Figure 4.
Figure 4.
Requirement of GCN2, GCN4, FLO8, and TPK2 for amino acid starvation-induced adhesive growth and FLO11 expression in diploid S. cerevisiae strains. (A) Diploid yeast strains RH2656 (control), RH2657 (gcn2Δ/gcn2Δ), RH2658 (gcn4Δ/gcn4Δ), RH2659 (tpk2Δ/tpk2Δ), RH2660 (flo8Δ/flo8Δ), RH2661 (flo11Δ/flo11Δ), L5627 (ste12Δ/ste12Δ), and HMC267 (tec1Δ/tec1Δ) carrying plasmid B3782 were assayed for adhesive growth as described for haploid strains in Figure 3. (B) Expression of FLO11-lacZ. Strains used in A were grown to logarithmic phase in YNB + Arg medium (high N) or YNB + Arg medium containing 10 mM 3AT (high N + 10 mM 3AT) before specific β-galactosidase activities were measured. Bars depict means of at least three independent measurements of β-galactosidase activities with a SD not exceeding 15%. Units are nanomoles per minute per milligram. (C) Diploid yeast strains RH2656 (control), RH2657 (gcn2Δ/gcn2Δ), RH2658 (gcn4Δ/gcn4Δ), and RH2661 (flo11Δ/flo11Δ) carrying plasmid B3782 were streaked on nitrogen starvation plates (SLAD) for induction of pseudohyphal growth. Pictures weretakenafter 3 d of incubation at 30°C. Bar, 50 μm.
Figure 2.
Figure 2.
Transcript levels of FLO11, FLO8, and ACT1. Total RNAs were prepared from haploid yeast strains RH2648 (control), RH2649 (gcn2Δ), RH2650 (gcn4Δ), and the diploid yeast strains RH2656 (control), RH2657 (gcn2Δ/gcn2Δ), RH2658 (gcn4Δ/gcn4Δ) grown in high ammonium medium (YNB + Ura + Arg) to logarithmic phase before (–) and after (+) induction of amino acid starvation by addition of 10 mM 3AT. For measurements of FLO11, FLO8, and ACT1 transcript levels, 10 μg of total RNA from each sample was subjected to a Northern hybridization analysis. Signals were quantified using a phosphorimaging scanner. Numbers given indicate relative expression levels of FLO11 when compared with ACT1 as internal standard with a value for nonstarvation expression of the haploid control strain set to 100. Values represent the average of three independent measurements.
Figure 5.
Figure 5.
Sequence elements involved in regulation of FLO11. (A) The specific β-galactosidase activities of 15 yeast strains carrying individual 200-base pair deletions of the FLO11 promoter region were compared with a yeast strain carrying the full-length 3-kbp wild-type promoter under nonstarvation (nonstarv) and amino acid starvation conditions (3AT) in haploid as well as in diploid yeasts (Table 3). Individual 200-base pair segments within the FLO11 promoter region are numbered from 1 to15 and their relative position in kilobases is shown with respect to the translational start site. A ratio of specific β-galactosidase activity (deletion/3 kbp promoter) of three or higher was defined as URS. URS elements under nonstarvation conditions are marked by a square (URS nonstarv) and under starvation conditions by a hexagon (URS 3AT). At least 50% lower expression than the wild-type reporter is represented as an UAS. UAS elements under nonstarvation conditions are marked by a circle (UAS nonstarv) and under starvation conditions by a star (UAS 3AT). Elements, which occur only in the diploid strain are marked by a D. (B) Expression of 19 CYC1-lacZ reporter constructs carrying isolated segments of the FLO11 promoter region was determined in haploid wild-type cells or in corresponding cells deleted for the transcription factors GCN4 or FLO8 under nonstarvation or amino acid starvation conditions (Table 4). The symbols (white cross, nonstarvation conditions, gray cross, starvation conditions) are placed on a line in a position that indicates, which of the fragments stimulated β-galactosidase activity. Each line represents the FLO11 promoter in the indicated genetic background. The first row (wt UAS) denotes sequence elements showing a >5-fold elevation of the reporter over a plasmid without an insert. The next two lines (gcn4Δ and flo8Δ) represent sequence elements showing a >3-fold reduction of the β-galactosidase activity in the mutant (gcn4Δ or flo8Δ) compared with the activity of the element in the control strain.
Figure 6.
Figure 6.
Model for regulation of FLO11 by amino acid starvation, Gcn4p, and Flo8p. Shown is the promoter of FLO11 and the regulatory elements that confer regulation by amino acid starvation (UASR and URS) or basal regulation under nonstarvation conditions (UASB). Gcn4p is postulated to control basal and amino acid starvation-regulated expression of FLO11 indirectly, whereas control of FLO11 expression by Flo8p can be indirectly or directly, as shown previously (Pan and Heitman, 2002). PKA, cAMP-dependent protein kinase.

References

    1. Albrecht, G., Mösch, H.-U., Hoffmann, B., Reusser, U., and Braus, G.H. (1998). Monitoring the Gcn4 protein-mediated response in the yeast Saccharomyces cerevisiae. J. Biol. Chem. 273, 12696–12702. - PubMed
    1. Ausubel, F.M., Brent, R., Kingston, R.E., Moore, D.D., Seidman, J.G., Smith, J.A., and Struhl, K. (1993). Current Protocols in Molecular Biology. New York: Greene Publishing Associates and Wiley Interscience.
    1. Banuett, F. (1998). Signalling in the yeasts: an informational cascade with links to the filamentous fungi. Microbiol. Mol. Biol. Rev. 62, 249–274. - PMC - PubMed
    1. Bisson, L.F. (1991). Influence of nitrogen on yeast and fermentation of grapes. In: Proceedings of the International Symposium on Nitrogen in Grapes and Wine, Seattle, WA: American Society of Enology and Viticulture.
    1. Bradford, M. (1976). A rapid and sensitive method for the quantification of microgram quantities of protein utilizing the principle of protein-dye binding. Anal. Biochem. 72, 248–254. - PubMed

Publication types

MeSH terms

Substances

LinkOut - more resources