Comparative Study
. 2003;4(10):R61.
doi: 10.1186/gb-2003-4-10-r61. Epub 2003 Sep 25.

Time- and exercise-dependent gene regulation in human skeletal muscle

Affiliations
Comparative Study

Time- and exercise-dependent gene regulation in human skeletal muscle

Alexander C Zambon et al. Genome Biol. 2003.

Abstract

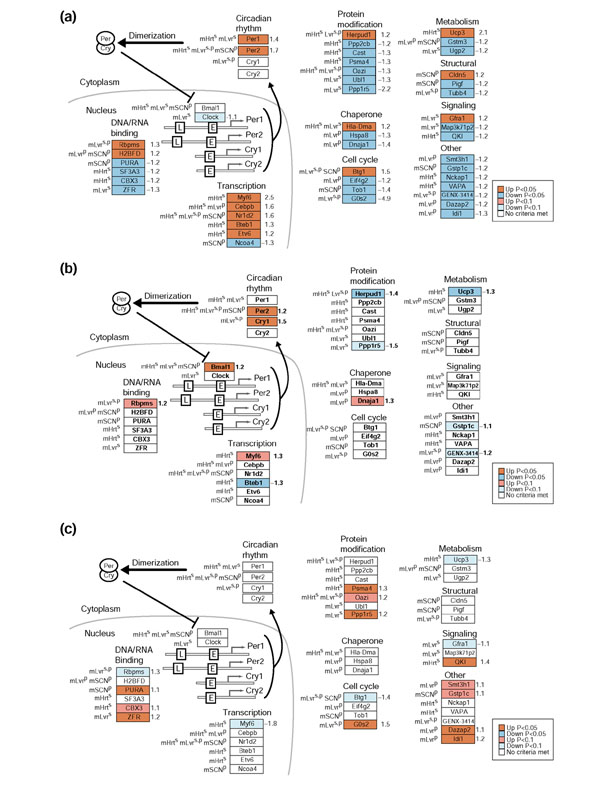
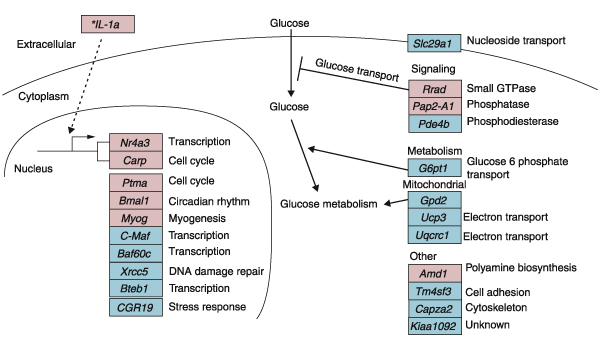
Background: Skeletal muscle remodeling is a critical component of an organism's response to environmental changes. Exercise causes structural changes in muscle and can induce phase shifts in circadian rhythms, fluctuations in physiology and behavior with a period of around 24 hours that are maintained by a core clock mechanism. Both exercise-induced remodeling and circadian rhythms rely on the transcriptional regulation of key genes.

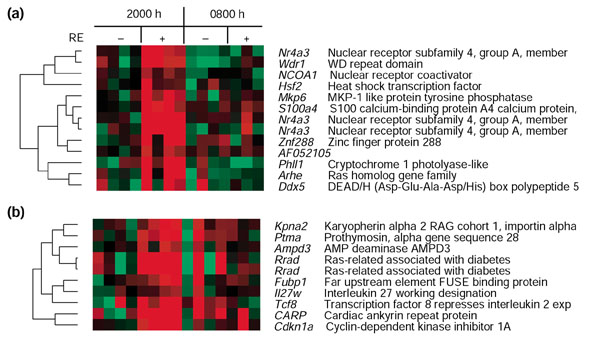
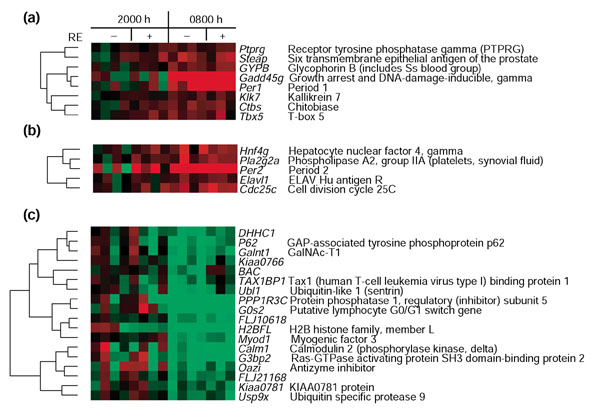
Results: We used DNA microarrays to determine the effects of resistance exercise (RE) on gene regulation in biopsy samples of human quadriceps muscle obtained 6 and 18 hours after an acute bout of isotonic exercise with one leg. We also profiled diurnal gene regulation at the same time points (2000 and 0800 hours) in the non-exercised leg. Comparison of our results with published circadian gene profiles in mice identified 44 putative genes that were regulated in a circadian fashion. We then used quantitative PCR to validate the circadian expression of selected gene orthologs in mouse skeletal muscle.

Conclusions: The coordinated regulation of the circadian clock genes Cry1, Per2, and Bmal1 6 hours after RE and diurnal genes 18 hours after RE in the exercised leg suggest that RE may directly modulate circadian rhythms in human skeletal muscle.


Figures

Figure 1
Figure 1
Venn diagrams of human genes undergoing diurnal regulation compared to their mouse circadian orthologs. (a) Comparison with mouse circadian gene orthologs reported in [19]; (b) comparison with mouse circadian gene orthologs reported in [20]. In the diurnal comparison (0800 vs 2000 h), 608 human genes were changed significantly (p < 0.05) in the non-exercised leg. An additional statistical filter was applied (p < 0.05 and absolute fold change > 20%) that resulted in a list of 239 diurnally regulated (0800 vs 2000 h) genes, that were compared with the mouse circadian orthologs. Gray shading indicates genes represented in Figure 2. Genes listed to the right of each Venn diagram are the intersection of all three tissues (red numbers). mHrts, mouse ortholog is circadian-regulated in heart [19] (n = 462); mLvrs, mouse ortholog is circadian-regulated in liver [19] (n = 575); mLvrp, mouse ortholog is circadian-regulated in liver [20] (n = 335); mSCNp, mouse ortholog is circadian-regulated in the SCN [20] (n = 337).
Figure 2
Figure 2
Human genes regulated in the diurnal comparison with orthologs that display circadian regulation in mouse heart and liver [19,20], and SCN [20]. The 608 significantly regulated (p < 0.05) hSkM genes identified in the diurnal comparison (0800 and 2000 hours) were subjected to an additional statistical filter of absolute fold change > 20% (n = 239) and linked to mouse circadian-regulated orthologs. The resultant 44 putative hSkM circadian-regulated genes are represented as boxes and colored in GenMAPP [57] using different filtering criteria. (a) The 44 putative hSkM circadian-regulated genes colored by p values and displaying fold changes from the diurnal comparison (0800 vs 2000 hours non-exercised leg). (b) The 44 putative hSkM circadian-regulated genes colored by p values and displaying fold changes from the comparison 6 hours after RE. (c) The 44 putative hSkM circadian-regulated genes colored by p values and displaying fold changes from the 18 hours after RE comparison. Red, blue, and gray boxes indicate significant upregulation, downregulation, and no significant regulation, respectively, using p-value stringencies defined in the key for each comparison. Numbers to the right of the gene boxes are the fold changes in the diurnal comparison. L, promoter for the light-responsive element; E, E-box (Clock/Bmal1 promoter). Ortholog information is denoted to the left of the gene boxes: mHrts and mLvrs, mouse ortholog was circadian-regulated as described [19] in mouse heart or liver, respectively; mLvrp and mSCNp, mouse ortholog was diurnally regulated as described [20] in mouse liver or SCN, respectively.
Figure 3
Figure 3
Confirmation of hSkM diurnal gene regulation by analysis of mSkM. Real-time RT-PCR (comparative CT method) was performed on total RNA isolated from wild-type C57BL/6J mouse quadriceps muscle, collected at the indicated zeitgeber times (ZT). (a) Genes with a cycling phase similar to that of Bmal1, a key diurnal clock gene, are shown. (b) Genes with a cycling phase similar to that of Per1 and Per2. One-way ANOVA was applied to all time points and confirmed a statistically significant effect of time on gene expression levels (p < 0.001 for Bmal1 and Hat; p < 0.05 for all others). By normalizing average peak value to the average trough value (12-hour opposite peak), the following fold increases in gene expression were calculated: Bmal1 = 4.1, G0s2 = 7.0, Cry1 = 4.5, Nfil3 = 11.1, Per1 = 3.5, Per2 = 13.0, C/EBPb = 3.5, MyF6 = 3.3, Ier3 = 1.8, Hat = 1.8, and Gadd = 2.1. Values are mean 6 SEM. Gapdh was used as the reference gene and is included as the negative control.
Figure 4
Figure 4
Gene-regulation model 6 hours after RE. The 144 human genes significantly changed (p < 0.05 and fold change > 20%) 6 hours after RE were compared to transcriptionally or translationally regulated rat orthologs (p < 0.05) 6 hours after RE in a rat model of RE [8]. Boxes represent individual human genes; red indicates upregulation and blue downregulation. *IL-1a was not found in the rat exercise data but is included for discussion purposes.
Figure 5
Figure 5
Cluster of genes upregulated 6 hours after RE. Columns indicate each subject and rows indicate individual genes. Each gene is represented by the difference of the genes expression value and the average expression value of the four non-exercised control legs 6 hours after RE. Red indicates upregulated genes, and green indicates downregulated genes. Gene names and descriptions (or GenBank IDs) appear to the right.
Figure 6
Figure 6
Cluster of genes regulated in the 0800 hours biopsies. Columns indicate each subject and rows indicate individual genes. Each gene is represented by the difference of the gene-expression value and the average expression value of the four non-exercised control legs 6 hours after RE. Red indicates upregulated genes; green indicates downregulated genes. Gene names and descriptions (or GenBank IDs) appear to the right. (a) Per1 0800 hours upregulated cluster. (b) Per2 0800 hours upregulated cluster. (c) 0800 hours downregulated cluster.
Figure 7
Figure 7
Diagram of the experimental protocol. Each volunteer performed a bout of resistance exercise (RE) consisting of 10 sets of eight repetitions of isometric knee extension at 80% of the predetermined one-repetition maximum with a single leg. Biopsies were obtained 6 and 18 hours after RE in both the exercised and non-exercised (contralateral) leg. Arrows denote the three comparisons of gene expression in the biopsy samples.

References

    1. Ryan AS. Insulin resistance with aging: effects of diet and exercise. Sports Med. 2000;30:327–346. - PubMed
    1. Pollock ML, Franklin BA, Balady GJ, Chaitman BL, Fleg JL, Fletcher B, Limacher M, Piña IL, Stein RA, Williams M, Bazzarre T. AHA Science Advisory. Resistance exercise in individuals with and without cardiovascular disease: benefits, rationale, safety, and prescription. An advisory from the Committee on Exercise, Rehabilitation, and Prevention, Council on Clinical Cardiology, American Heart Association; Position paper endorsed by the American College of Sports Medicine. Circulation. 2000;101:828–833. - PubMed
    1. Baar K, Esser K. Phosphorylation of p70(S6k) correlates with increased skeletal muscle mass following resistance exercise. Am J Physiol. 1999;276:C120–C127. - PubMed
    1. McCall GE, Byrnes WC, Dickinson A, Pattany PM, Fleck SJ. Muscle fiber hypertrophy, hyperplasia, and capillary density in college men after resistance training. J Appl Physiol. 1996;81:2004–2012. - PubMed
    1. Dusterhoft S, Putman CT, Pette D. Changes in FGF and FGF receptor expression in low-frequency-stimulated rat muscles and rat satellite cell cultures. Differentiation. 1999;65:203–208. - PubMed

Publication types