. 2003 Oct 1;17(19):2465-79.
doi: 10.1101/gad.277003.

Beta1 integrins regulate chondrocyte rotation, G1 progression, and cytokinesis

Affiliations

Beta1 integrins regulate chondrocyte rotation, G1 progression, and cytokinesis

Attila Aszodi et al. Genes Dev. .

Abstract

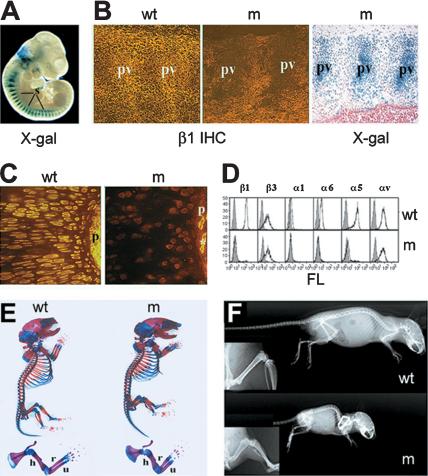
Beta1 integrins are highly expressed on chondrocytes, where they mediate adhesion to cartilage matrix proteins. To assess the functions of beta1 integrin during skeletogenesis, we inactivated the beta1 integrin gene in chondrocytes. We show here that these mutant mice develop a chondrodysplasia of various severity. beta1-deficient chondrocytes had an abnormal shape and failed to arrange into columns in the growth plate. This is caused by a lack of motility, which is in turn caused by a loss of adhesion to collagen type II, reduced binding to and impaired spreading on fibronectin, and an abnormal F-actin organization. In addition, mutant chondrocytes show decreased proliferation caused by a defect in G1/S transition and cytokinesis. The G1/S defect is, at least partially, caused by overexpression of Fgfr3, nuclear translocation of Stat1/Stat5a, and up-regulation of the cell cycle inhibitors p16 and p21. Altogether these findings establish that beta1-integrin-dependent motility and proliferation of chondrocytes are mandatory events for endochondral bone formation to occur.


Figures

Figure 1.
Figure 1.
Deletion of the of β1 integrin gene and gross morphology of mutants. (A) Demonstration of the cre-mediated deletion of β1 integrin gene by whole-mount X-gal staining in E10.5 embryo heterozygous for the floxed β1 integrin allele and Col2a1-cre transgene. Note the strong LacZ activity in somites (s). (B) β1 integrin immunostaining (IHC) and X-gal staining in the developing vertebral column at E11.5. In wild type (w), β1 integrin expression was high at the areas of precartilaginous condensation of prevertebrae (pv), whereas mutant (m) prevertebrae lacked β1 integrin expression and displayed strong LacZ activity. (C) Immunostaining for β1 integrin in newborn (NB) tibia showed absent β1 integrin staining on mutant growth plate chondrocytes and in the perichondrium (p). Asterisk indicates a β1-integrin-positive vessel in the mutant perichondrium. (D) FACS analysis of primary rib chondrocytes confirmed the absence of β1 integrin, and β1 integrin-associated α subunits (α1, α5, and α6) on mutant cells. (E) Alizarin-red and alcian-blue double skeletal staining for bony and cartilaginous tissues, respectively, revealed the presence of all skeletal elements in mutant mice. Closer view of the forelimb indicated that the long bones [(h) humerus; (r) radius; (u) ulna] are shorter and broader. (F) X-ray analysis at 9 wk of age revealed a further size reduction and mild lordosis of mutant compared with control. (Insets) Closer view on the hindlimb showed broadened bones but no apparent alteration of the bone density.
Figure 2.
Figure 2.
Histological analysis of endochondral bone formation in wild-type (wt) and mutant (m) mice. (A-D,E,G,H,J) Safranin-orange-van Kossa staining. (F,I,K,L) Toulidin-blue staining. (A-D) At E14.5, the mutant humerus (hu; C) was significantly shorter, and the central hypertrophic region (h) was reduced compared with wild-type humerus (A). (B) Higher magnification demonstrates the vascular invasion of the primary ossification center, and the mineralization of the bone collar and the matrix of the terminal hypertophic chondrocytes in wild type. (D) On the contrary, no vascularization was observed in the mutant, and the mineralization was restricted to the periosteum. (E-J) At E17.5, the metaphysis of the mutant humerus was greatly shortened with distinct trabeculae and bone collar (H). The typical columnar arrangement of the growth plate chondrocytes seen in the wild type (F) was disorganized in the mutant (I). (F, inset) Two rotating chondrocytes (arrow). In the mutant growth plate (I), the chondrocytes lie side by side (arrow and inset) and were fewer in number. The longitudinal septae of the terminal hypertrophic chondrocytes showed fewer and patchy mineral deposits in the mutant (J) compared with those in wild type (G). (K,L) Growth plate (gp) morphology in tibia of 6-week-old mice. The growth plate was broadened in the mutant, lacked the columnar organization (L), and contained binucleate chondrocytes (arrows).
Figure 3.
Figure 3.
Adhesion and spreading abnormalities of mutant primary chondrocytes. (A) Adhesion assay. Lack of adhesion of mutant chondrocytes to collagen II (CII) and laminin I (LN), reduced adhesion to fibronectin (FN), and normal adhesion to vitronectin (VN). The numbers represent the mean adhesion; error bars represent SD. (B) Spreading assay. Mutant chondrocytes showed impaired spreading on fibronectin with less actin stress fibers and reduced recruitment of FA proteins (paxillin, zyxin). On vitronectin, the spreading of mutant chondrocytes was less affected. (C) Confocal microscopy of actin distribution in chondrocytes of epiphyseal cartilage. Wild-type chondrocytes showed even cortical staining with phalloidin. Mutant cells display a punctuated actin distribution.
Figure 4.
Figure 4.
Organization of the collagen network is dependent on β1 integrins. (A-D) Electron micrographs of the cartilage matrix compartments of normal and mutant growth plates. (A,B) Reduced collagen fibrillar density in the interterritorial matrix (A) and in the territorial/pericellular compartments (B) of the mutant proliferative zone at the newborn stage. (C) At 6 wk, areas with sparse and disorganized collagen fibril networks were frequently found in the proliferative zone. (D) Note the fibrils with abnormally large diameters in the resting zone of mutant tissue. (E-G) Normal skeletal development of mice with deleted fibronectin gene in cartilage. (E) Immunostaining demonstrates the lack of fibronectin in the matrix of Col2a1-cre/FNfl/fl mice at 4 wk of age. (F) Hematoxilin-ChromotropIIR staining indicates normal growth plate structure in mutant mice. (G) X-ray analysis of 9-month-old mice demonstrated a normal skeleton in the mutant.
Figure 5.
Figure 5.
Analysis of the differentiation events of long bone development. (A) Immunostaining of tibia for collagen type II (Col2) and collagen type X (Col10) at E17.5. The deposition of type X collagen, a marker for hypertrophic and prehypertrophic chondrocytes, was extended into the proliferative zone of the mutant growth plate. (B) In situ hybridization for collagen II (Col2a1), collagen X (Col10a1), Indian hedgehog (Ihh), and PTH/PTHrP receptor (Ppr). In wild type, Col2a1 was strongly expressed in the proliferative (p) and prehypertrophic (ph) zones and to lesser extent in the hypertrophic zone (h), Col10a1 in the hypertrophic and prehypertrophic zone, and Ihh and PP-R in the prehypertrophic zone. In the mutant, the expression of Col2a1 was normal, whereas the expression domain of Col10a1 was reduced in the hypertrophic zone and broadened in the prehypertrophic zone. The expression of Ihh and PP-R was also broadened in the prehypertrophic zone. (C) Expression of Fgfr1-3 and Bmp2 in tibia at E15.5. Whereas expression of Fgfr1, Fgfr2, and Bmp2 was normal, the expression of Fgfr3 was up-regulated in mutant cartilage. (D) Northern blot hybridization of total RNAs derived from primary chondrocytes isolated from E17.5 limb cartilage. Expression of Col2a1, Col9a1, and matrilin1 (Matn1) was not altered in mutant chondrocytes. The expression of Fgfr3 was increased, whereas the expression of Col10a1 was decreased in mutant chondrocytes.
Figure 6.
Figure 6.
Analyses of chondrocyte proliferation and apoptosis in wild-type (wt) and mutant (m) mice. (A) Analysis of chondrocyte proliferation by BrdU incorporation assay. The diagram shows a progressive reduction of BrdU-labeled nuclei from E14.5 to 6 wk of age. Error bars represent S.D. Asterisks indicate a statistically significant difference between control and wild type (*, P < 0.05; **, P < 0.01). (B) Diagram showing the percentage of cyclin-D-positive cells in wild-type and mutant growth plates assessed by immunostaining at various stages. (C) Diagram showing the percentage of TUNEL and cleaved caspase-3 (cl. casp-3) positive chondrocytes in newborn and 6-week-old tibias. (D) Western blotting demonstrated decreased tyrosine phosphorylation level of FAK at the tyrosine residues 861 (pY861) and 397 (pY397). The blot was reprobed for total FAK. (E) Reduced FAK activation was not associated with decreased recruitment of p130cas and paxilin. FAK immunoprecipitates were analyzed by Western blotting with antibodies against FAK, FAK Tyr 397 (pY397), p130cas, paxillin, and phospho-paxillin (p-paxillin). (F) Western blot analysis of MAP-kinases activity. The levels of phosphorylated Erk1 and Erk2 were apparently normal at the newborn stage in mutant cells. At 6 wk, phospho-Erk2 was detected in wild-type but not in mutant samples. The blots were reprobed for total Erk. (G) Analysis of the expression level of ILK and the phosphorylated form of GSK3α/β. The levels of ILK and phospho-GSK3α/β were normal in the mutant. (H) Biochemical analysis of apoptosis in newborn primary chondrocytes. The level of cleaved caspase-3 (cl. casp-3; upper panel) and the levels of phosphorylated Akt Thr 308 and Ser 473 (lower panel) were not significantly different in the mutant compared with wild type. The blots were reprobed for uncleaved caspase-3 (ucl. casp-3) and total Akt.
Figure 7.
Figure 7.
Increased expression of the cell cycle inhibitor p16 and p21 and nuclear translocation of Stat1 and Stat5a in β1-null proliferative chondrocytes. (A) Immunohistochemistry for cell cycle inhibitors in E17.5 wild-type (wt) and mutant (m) growth plates. The expression of p16 and p21 was selectively increased in the mutant proliferative zone (p), whereas the expression of p27 and 57 was similar as in wild type. (ph) Prehypertophic zone; (h) hypertrophic zone. (B) Diagram showing the percentage of cell-cycle-inhibitor-positive cells in the proliferative zone of the growth plate and in the epiphyseal cartilage. Error bars represent S.D. Asterisks indicate a statistically significant difference between control and wild type (*, P < 0.05; **, P < 0.01). (C) Immunostaining for Stat1 and Stat5a indicates increased nuclear translocation (arrows) in the mutant proliferative zone.
Figure 8.
Figure 8.
β1-integrin-deficient chondrocytes accumulate in the G2/M phase and show a high rate of binucleation. (A) FACS analysis of cell cycle distribution of newborn wild-type and mutant primary chondrocytes. (B) Electron micrographs showing chondrocyte morphology in the resting (RZ), proliferative (PZ), and hypertrophic (HZ) zones of the growth plate of wild-type (wt) and mutant (m) tibia at E17.5. Note the round shape and increased size of chondrocytes in each zone of the mutant growth plate. Mutant cells had decreased euchromatin and frequently showed binucleation. (C) Diagram showing the percentage of multinucleate chondrocytes in the zones of wild-type and mutant cartilage at E17.5. Error bars represent S.D. (*, P < 0.05; **, P < 0.0001). (D) Localization of β1 integrin in the cleavage furrow. Dividing wild-type primary chondrocytes were immunostained for actin and β1 integrin. DNA was visualized with DAPI staining.

References

    1. Aszodi A., Chan, D., Hunziker, E., Bateman, J.F., and Fässler, R. 1998. Collagen II is essential for the removal of the notochord and the formation of intervertebral discs. J. Cell Biol. 143: 1399-1412. - PMC - PubMed
    1. Aszodi A., Bateman, J.F., Hirsch, E., Baranyi, M., Hunziker, E.B., Hauser, N., Bösze, Z., and Fässler, R. 1999. Normal skeletal development of mice lacking matrilin 1: Redundant function of matrilins in cartilage? Mol. Cell. Biol. 19: 7841-7845. - PMC - PubMed
    1. Beier F., Leask, T.A., Haque, S., Chow, C., Taylor, A.C., Lee, R.J., Pestell, R.G., Ballock, R.T., and LuValle, P. 1999. Cell cycle genes in chondrocyte proliferation and differentiation. Matrix Biol. 18: 109-120. - PubMed
    1. Bellissent-Waydelich A., Vanier, M.T., Albiges-Rizo, C., and Simon-Assmann, P. 1999. Talin concentrates to the mid-body region during mammalian cell cytokinesis. J. Histochem. Cytochem. 47: 1357-1368. - PubMed
    1. Bouvard D., Brakebusch, C., Gustafsson, E., Aszodi, A., Bengtsson, T., Berna, A., and Fässler, R. 2001. Functional consequences of integrin gene mutations in mice. Circ. Res. 89: 211-223. - PubMed

Publication types

MeSH terms