. 2003 Oct;112(7):1019-28.
doi: 10.1172/JCI18062.

Congenital sick sinus syndrome caused by recessive mutations in the cardiac sodium channel gene (SCN5A)

Affiliations

Congenital sick sinus syndrome caused by recessive mutations in the cardiac sodium channel gene (SCN5A)

D Woodrow Benson et al. J Clin Invest. 2003 Oct.

Abstract

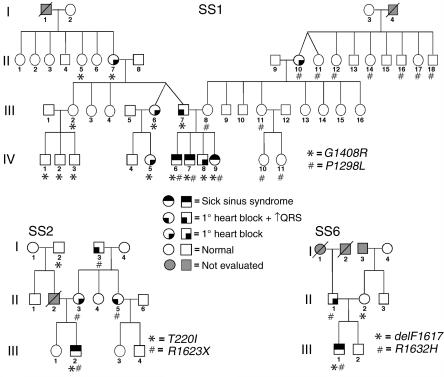
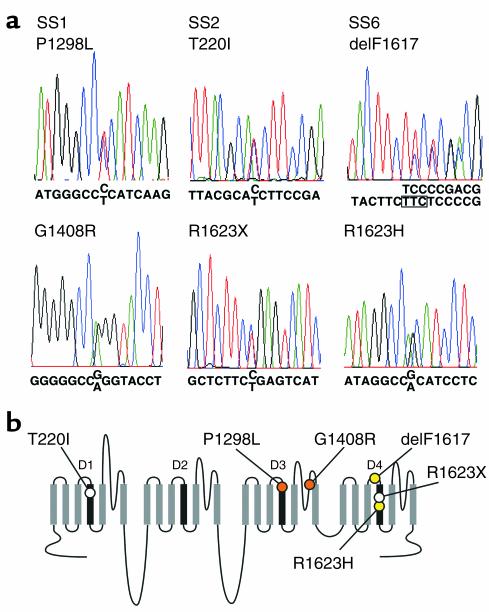
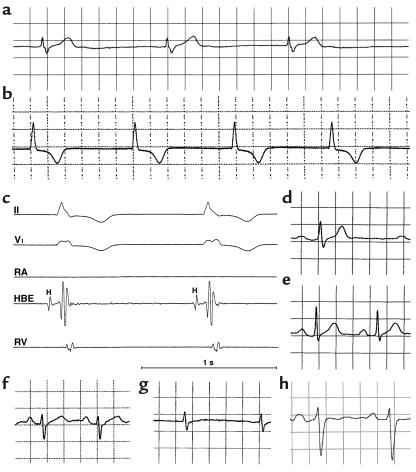
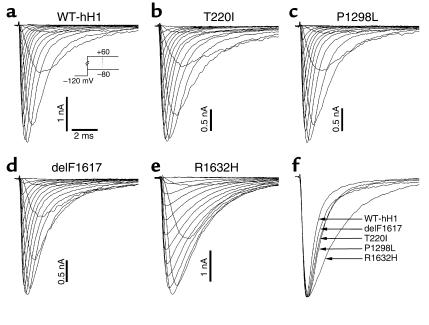
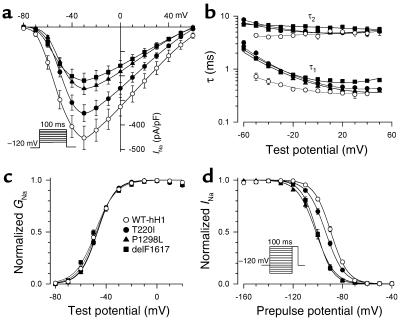
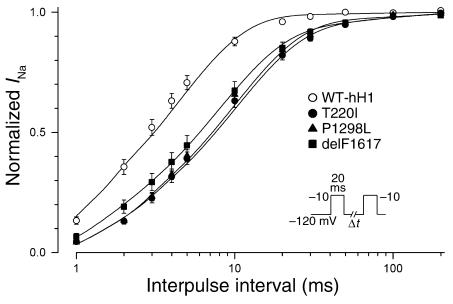
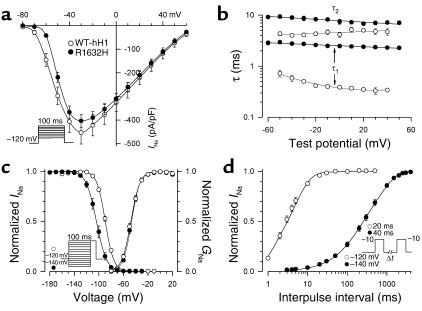
Sick sinus syndrome (SSS) describes an arrhythmia phenotype attributed to sinus node dysfunction and diagnosed by electrocardiographic demonstration of sinus bradycardia or sinus arrest. Although frequently associated with underlying heart disease and seen most often in the elderly, SSS may occur in the fetus, infant, and child without apparent cause. In this setting, SSS is presumed to be congenital. Based on prior associations with disorders of cardiac rhythm and conduction, we screened the alpha subunit of the cardiac sodium channel (SCN5A) as a candidate gene in ten pediatric patients from seven families who were diagnosed with congenital SSS during the first decade of life. Probands from three kindreds exhibited compound heterozygosity for six distinct SCN5A alleles, including two mutations previously associated with dominant disorders of cardiac excitability. Biophysical characterization of the mutants using heterologously expressed recombinant human heart sodium channels demonstrate loss of function or significant impairments in channel gating (inactivation) that predict reduced myocardial excitability. Our findings reveal a molecular basis for some forms of congenital SSS and define a recessive disorder of a human heart voltage-gated sodium channel.


Figures

Figure 1
Figure 1
Congenital SSS pedigrees. Three families (SS1, SS2, SS6) with compound heterozygosity for SCN5A mutations are presented along with phenotype assignments (see symbol key) and genotypes (allele designations are indicated in the lower right of each pedigree). In the SS1 family three individuals had compound heterozygous SCN5A mutations, while in SS2 and SS6 a single individual with a compound heterozygous mutation was identified. In the three kindreds, 27 individuals were heterozygous for an SCN5A mutation, but only 10 individuals demonstrated an asymptomatic ECG phenotype of first-degree heart block (penetrance = 37%). Slashed symbols indicate deceased individuals; Roman numerals indicate generations in the respective families.
Figure 2
Figure 2
Sequencing of SCN5A mutations. (a) Automated DNA-sequencing electrophoretographs illustrating the two mutations segregating in each family (SS1, SS2, and SS6) are tiled vertically. (b) Schematic of the transmembrane topology of SCN5A illustrating the location of mutations found in congenital SSS families. Mutations are colored to indicate in which family they occur (orange circles = SS1, open circles = SS2, yellow circles = SS6). D1–D4 indicate homologous domains of the α subunit of the cardiac sodium channel.
Figure 3
Figure 3
Electrocardiographic phenotypes. (a) Lead II rhythm strip from proband (age 6 years) of family SS1 showing absent P waves and prolonged QRS duration. (b and c) Lead II rhythm strip and intracardiac electrophysiologic tracings from proband family SS2 (III-2) at age 9 years. No P waves were evident on surface tracings, and no atrial activity was documented with intracardiac recording. Atrial pacing could not be achieved even with high output (stimuli of 7 mA, 3 milliseconds). Both QRS duration (100 milliseconds, normal for age is less than 85 milliseconds) and His-ventricular interval (80 milliseconds, normal is less than 50 milliseconds) are prolonged. HBE, His bundle electrogram; H, potential recorded from the His bundle; RA, right atrium; RV, right ventricle. (d and e) Lead II tracing from members of SS1, heterozygous for G1408R, showing (d) first-degree heart block with prolonged QRS (III-7) (e) first-degree heart block (IV-8). (f and g) In a compound heterozygote from family SS1 (IV-9), lead II tracings showing transition from first-degree heart block (f) to sinus arrest (g) at age 17 months and 25 months, respectively. (h) Lead II tracing showing first-degree heart block and prolonged QRS duration in individual II-5 family SS2, heterozygous for R1623X. A 1-second time scale is shown in c; electrocardiographic traces were obtained at standard recording conditions of 25 mm/s and 10 mm/mV.
Figure 4
Figure 4
Whole-cell current recordings of wild-type and mutant Na channels. (ae) Na channels were expressed by transient transfection in tsA201 cells in the presence of hβ1 and currents recorded at various membrane potentials from –80 to +60 mV in 10-mV increments from a holding potential of –120 mV. (f) Normalized Na current at test potential of –20 mV for WT-hH1, T220I, P1298L, delF1617, and R1632H.
Figure 5
Figure 5
Impaired fast inactivation in mutant sodium channels. (a) Current-voltage relationship for WT-hH1 (open circles, n = 16), T220I (filled circles, n = 25), P1298L (filled triangles, n = 17), and delF1617 (filled squares, n = 17) sodium channels. Current (in pA) is normalized to cell capacitance (in picofarads, pF) to give a measure of sodium current density. Current density is significantly lower for T220I, P1298L, and delF1617 at test potentials between –60 mV and +60 mV (P < 0.05). (b) Voltage dependence of fast inactivation time constants (τ1 and τ2) for WT-hH1 (open circles, n = 16), T220I (filled circles, n = 25), P1298L (filled triangles, n = 17), and delF1617 (filled squares, n = 17). Lower and upper bundles of symbols indicate τ1 and τ2 values, respectively. Differences between WT-hH1 and mutant channels were significant for τ1 (T220I and P1298L; P < 0.05 at tested voltage between –50 to –10 mV; delF1617, P < 0.05 at all tested voltages). In some cases, error bars are smaller than the data symbol. (c) Voltage dependence of activation for WT-hH1 (open circles), T220I (filled circles), P1298L (filled triangles), and delF1617 (filled squares). Curves were fit with a Boltzmann distribution, and values determined for the voltage midpoint (V1/2) and slope factor (k) are shown in Table 2. G, conductance. (d) Sodium channel availability for WT-hH1 (n = 19), T220I (n = 30), P1298L (n = 32), and delF1617 (n = 12) recorded using the pulse protocol shown in the inset and fit with Boltzmann distributions (solid lines). The half-maximal voltage for Na channel inactivation (V1/2) and slope factor are listed in Table 2.
Figure 6
Figure 6
SCN5A mutants exhibit impaired recovery from inactivation. The time course of recovery from inactivation was elicited using the two-pulse protocol shown in the inset. Time constants and fractional amplitudes are listed in Table 2.
Figure 7
Figure 7
Biophysical properties of R1632H. (a) Comparison of current-voltage relationship for WT-hH1 (open circles) and R1632H (filled circles, n = 25). Current is normalized to cell capacitance to give a measure of sodium current density. There is no difference in current density between WT-hH1 and R1632H at all tested voltages. (b) Voltage dependence of fast inactivation time constants for WT-hH1 (open circles) and R1632H (filled circles, n = 25). Differences between WT-hH1 and mutant channel were significant for τ1 (P < 0.0001) and τ2 (P < 0.05) at voltages between –60 to +50 mV. (c) Voltage dependence of sodium channel availability and activation (symbol definitions are shown as an inset, and their shading patterns are explained in the y-axis labels). Voltage dependence of sodium channel availability (steady-state inactivation) was obtained using a two-pulse protocol as illustrated by the inset. The membrane potentials for half-maximal inactivation and slope factors are provided in Table 2. The activation curve was constructed as described in the legend of Figure 5, and parameters are given in Table 2. (d) Time course of recovery from inactivation at –120mV (–140 mV for R1632H). The time constants and fractional amplitudes (given in parentheses) are provided in Table 2.

Similar articles

Cited by

References

    1. Lown B. Electrical reversion of cardiac arrhythmias. Br. Heart J. 1967;29:469–489. - PMC - PubMed
    1. Fish, F.A., and Benson, D.W. 2001. Disorders of cardiac rhythm and conduction. In Moss and Adam’s heart disease in infants, children and adolescents. H.D. Allen, E.B. Clark, H.P. Gutgesell, and D.J. Driscoll, editors. Lippincott, Williams & Wilkins. Philadelphia, Pennsylvania, USA. 482–533.
    1. Martin, A.B., and Kugler, J.D. 1999. Sinus node dysfunction. In Clinical pediatric arrhythmias: electrophysiology and pacing. P.C. Gillette and A.J. Garson, editors. W.B. Saunders. Philadelphia, Pennsylvania, USA. 51–62.
    1. Yabek SM, Swensson RE, Jarmakani JM. Electrocardiographic recognition of sinus node dysfunction in children and young adults. Circulation. 1977;56:235–239. - PubMed
    1. Yabek SM, Jarmakani JM. Sinus node dysfunction in children, adolescents, and young adults. Pediatrics. 1978;61:593–598. - PubMed

Publication types