Identification of biomarkers for ovarian cancer using strong anion-exchange ProteinChips: potential use in diagnosis and prognosis
- PMID: 14523236
- PMCID: PMC218760
- DOI: 10.1073/pnas.2033602100
Identification of biomarkers for ovarian cancer using strong anion-exchange ProteinChips: potential use in diagnosis and prognosis
Abstract
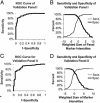
One hundred eighty-four serum samples from patients with ovarian cancer (n = 109), patients with benign tumors (n = 19), and healthy donors (n = 56) were analyzed on strong anion-exchange surfaces using surface-enhanced laser desorption/ionization time-of-flight mass spectrometry technology. Univariate and multivariate statistical analyses applied to protein-profiling data obtained from 140 training serum samples identified three biomarker protein panels. The first panel of five candidate protein biomarkers, termed the screening biomarker panel, effectively diagnosed benign and malignant ovarian neoplasia [95.7% sensitivity, 82.6% specificity, 89.2% accuracy, and receiver operating characteristic (ROC) area under the curve of 0.94]. The other two panels, consisting of five and four candidate protein biomarkers each, effectively distinguished between benign and malignant ovarian neoplasia and were therefore referred to as validation biomarker panel I (81.5% sensitivity, 94.9% specificity, 88.2% accuracy, and ROC = 0.94) and validation biomarker panel II (72.8% sensitivity, 94.9% specificity, 83.9% accuracy, and ROC = 0.90). The three ovarian cancer biomarker protein panels correctly diagnosed 41 of the 44 blinded test samples: 21 of 22 malignant ovarian neoplasias [10 of 11 early-stage ovarian cancer (I/II) and 11 of 11 advanced-stage ovarian cancer (III/IV)], 6 of 6 low malignant potential, 5 of the 6 benign tumors, and 9 of 10 normal patient samples. In conclusion, we have discovered three ovarian cancer biomarker protein panels that, when used together, effectively distinguished serum samples from healthy controls and patients with either benign or malignant ovarian neoplasia.
Figures


References
-
- Farias-Eisner, R., Teng, F., Oliveira, M., Leuchter, R., Karlan, B., Lagasse, L. D. & Berek, J. S. (1994) Gynecol. Oncol. 55, 108–110. - PubMed
-
- Farias-Eisner, R., Kim, Y. B. & Berek, J. S. (1994) Semin. Surg. Oncol. 10, 268–275. - PubMed
-
- Morice, P., Brehier-Ollive, D., Rey, A., Atallah, D., Lhomme, C., Pautier, P., Pomel, C., Camatte, S., Duvillard, P. & Castaigne, D. (2003) Ann. Oncol. 14, 74–77. - PubMed
-
- Greenlee, R. T., Hill-Harmon, M. B., Murray, T. & Thun, M. (2001) CA Cancer J. Clin. 51, 15–36. - PubMed
-
- Coleman, M. P., Esteve, J., Damiecki, P., Arslan, A. & Renard, H. (1993) IARC Sci. Publ. 121, 1–806. - PubMed
Publication types
MeSH terms
Substances
Grants and funding
LinkOut - more resources
Full Text Sources
Other Literature Sources
Medical

