

doi: 10.1186/1475-2883-2-14.
Spatial variation of Anopheles-transmitted Wuchereria bancrofti and Plasmodium falciparum infection densities in Papua New Guinea
Affiliations
- PMID: 14525619
- PMCID: PMC212440
- DOI: 10.1186/1475-2883-2-14
Item in Clipboard
Spatial variation of Anopheles-transmitted Wuchereria bancrofti and Plasmodium falciparum infection densities in Papua New Guinea
Filaria J.
.
Abstract
The spatial variation of Wuchereria bancrofti and Plasmodium falciparum infection densities was measured in a rural area of Papua New Guinea where they share anopheline vectors. The spatial correlation of W. bancrofti was found to reduce by half over an estimated distance of 1.7 km, much smaller than the 50 km grid used by the World Health Organization rapid mapping method. For P. falciparum, negligible spatial correlation was found. After mass treatment with anti-filarial drugs, there was negligible correlation between the changes in the densities of the two parasites.
Figures
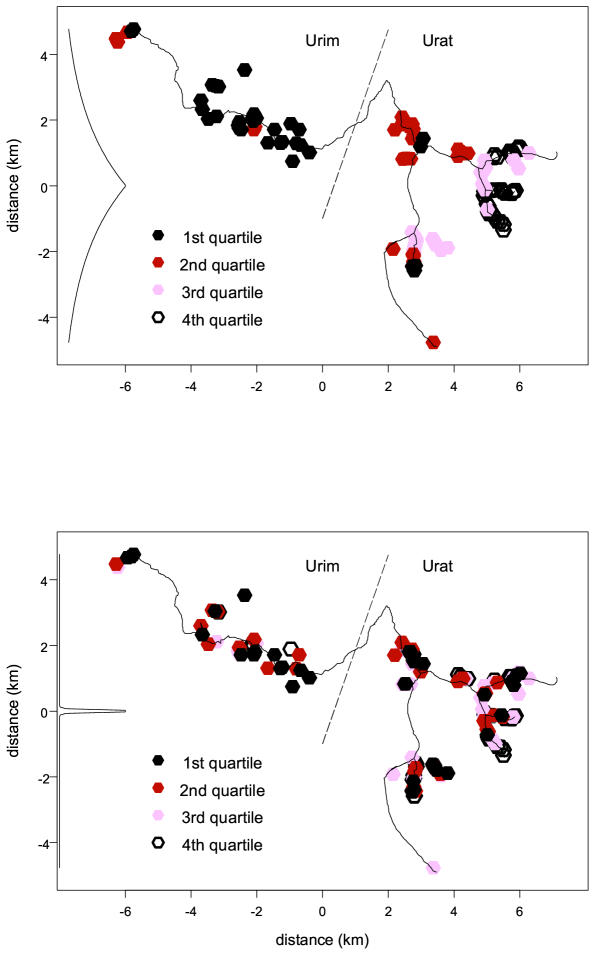
Spatial variation of a) W. bancrofti and b) P. falciparum in parts of Urim and Urat census districts, East Sepik Province. The scale is in kilometres with an arbitrary origin near the centre of the study area (142.7°E, 3.6°S). Each hexagon represents one hamlet, with the shading showing the quartile of the standardized parasite density ratio. For W. bancrofti, the 0, 25, 50, 75 and 100th percentiles are 0.27, 0.56, 1.02, 1.71 and 4.3 respectively. For P. falciparum they are 0.43, 0.94, 1.27, 1.80 and 11.64. The curve plotted against the vertical axis shows the rate at which correlation in mean parasite density decays with distance. The solid lines in the body of the map show unpaved roads, and the dashed line indicates the division of villages between the two census districts.
References
-
- Gyapong JO, Kyelem D, Kleinschmidt I, Agbo K, Ahouandogbo F, Gaba J, Owusu-Banahene G, Sanou S, Sodahlon YK, Biswas G, Kale OO, Molyneux DH, Roungou JB, Thomson MC, Remme J. The use of spatial analysis in mapping the distribution of bancroftian filariasis in four West African countries. Annals of Tropical Medicine and Parasitology. 2002;96:695–705. doi: 10.1179/000349802125001735. - DOI - PubMed
-
- Alexander NDE. Heterogeneity and the Epidemiology of Lymphatic Filariasis. Cambridge: University of Cambridge; PhD thesis. 1998.
-
- Pichon G, Leonard J, Gaillard FO, Pion S. Assessment of ELF program consequences on malaria transmission in West Africa. Vector-borne Diseases Control in the New Era: Science, Policy and Action; Vector Control Research Centre, Pondicherry, India. 2000. http://www.bondy.ird.fr/~pichon/biblio/Pondich1.html
LinkOut - more resources
Full Text Sources
