Apparent dependence of protein evolutionary rate on number of interactions is linked to biases in protein-protein interactions data sets
- PMID: 14525624
- PMCID: PMC270031
- DOI: 10.1186/1471-2148-3-21
Apparent dependence of protein evolutionary rate on number of interactions is linked to biases in protein-protein interactions data sets
Abstract
Background: Several studies have suggested that proteins that interact with more partners evolve more slowly. The strength and validity of this association has been called into question. Here we investigate how biases in high-throughput protein-protein interaction studies could lead to a spurious correlation.
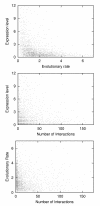
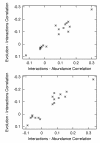
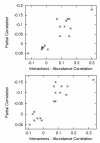
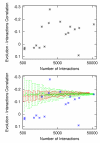
Results: We examined the correlation between evolutionary rate and the number of protein-protein interactions for sets of interactions determined by seven different high-throughput methods in Saccharomyces cerevisiae. Some methods have been shown to be biased towards counting more interactions for abundant proteins, a fact that could be important since abundant proteins are known to evolve more slowly. We show that the apparent tendency for interactive proteins to evolve more slowly varies directly with the bias towards counting more interactions for abundant proteins. Interactions studies with no bias show no correlation between evolutionary rate and the number of interactions, and the one study biased towards counting fewer interactions for abundant proteins actually suggests that interactive proteins evolve more rapidly. In all cases, controlling for protein abundance significantly decreases the observed correlation between interactions and evolutionary rate. Finally, we disprove the hypothesis that small data set size accounts for the failure of some interactions studies to show a correlation between evolutionary rate and the number of interactions.
Conclusions: The only correlation supported by a careful analysis of the data is between evolutionary rate and protein abundance. The reported correlation between evolutionary rate and protein-protein interactions cannot be separated from the biases of some protein-protein interactions studies to count more interactions for abundant proteins.
Figures


Comment in
-
Evolutionary rate depends on number of protein-protein interactions independently of gene expression level.BMC Evol Biol. 2004 May 27;4:13. doi: 10.1186/1471-2148-4-13. BMC Evol Biol. 2004. PMID: 15165289 Free PMC article.
References
Publication types
MeSH terms
Substances
LinkOut - more resources
Full Text Sources
Molecular Biology Databases

