

Contribution of ionic currents to magnetoencephalography (MEG) and electroencephalography (EEG) signals generated by guinea-pig CA3 slices
- PMID: 14528026
- PMCID: PMC2343617
- DOI: 10.1113/jphysiol.2003.051144
Contribution of ionic currents to magnetoencephalography (MEG) and electroencephalography (EEG) signals generated by guinea-pig CA3 slices
Abstract
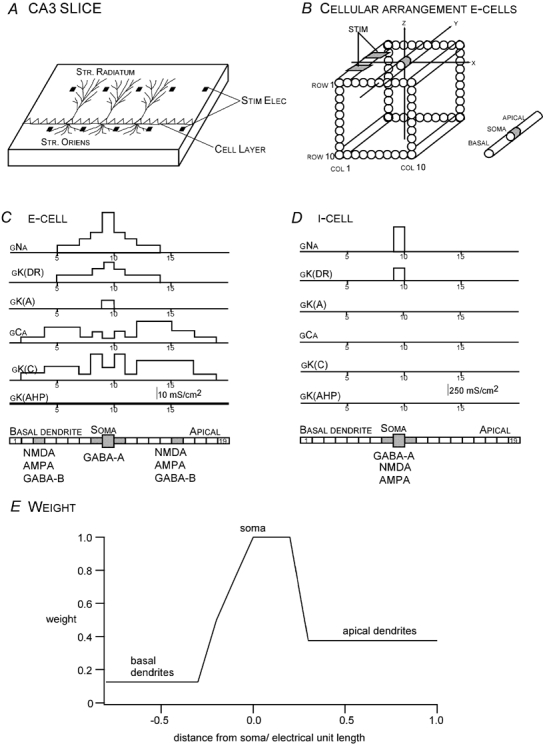
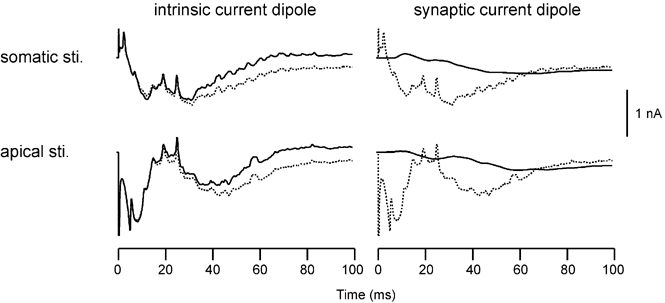
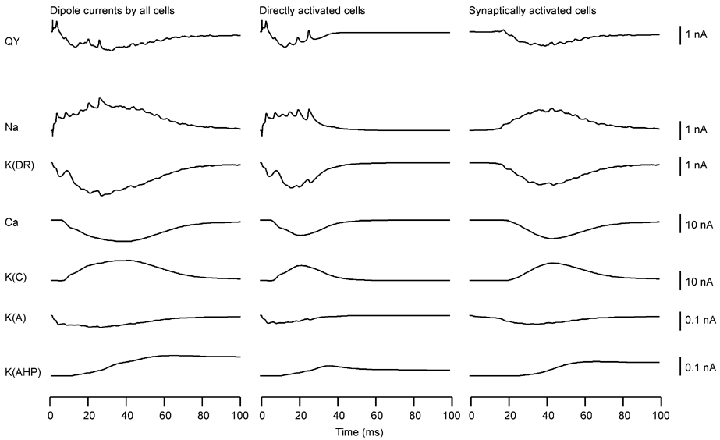
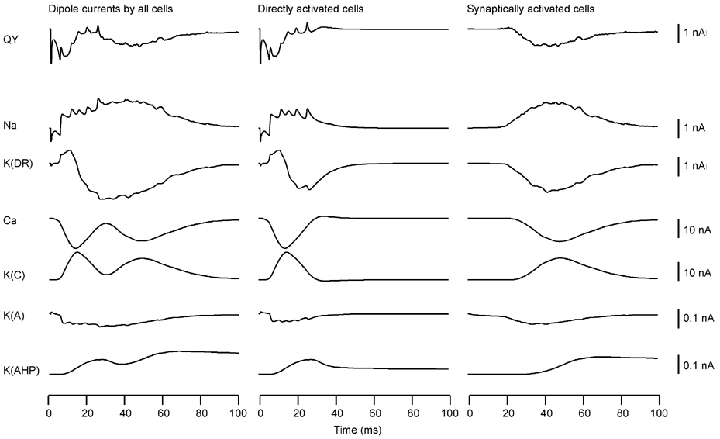
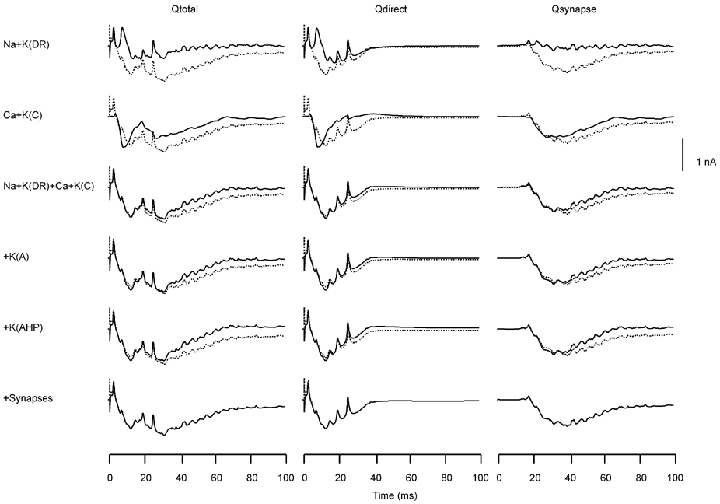
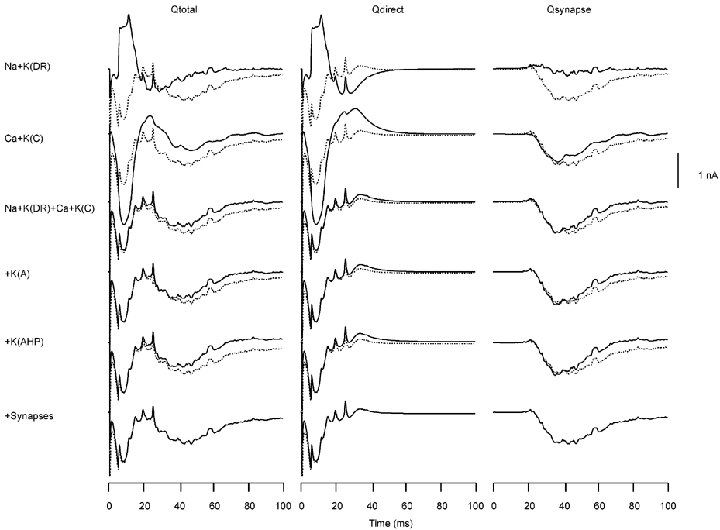
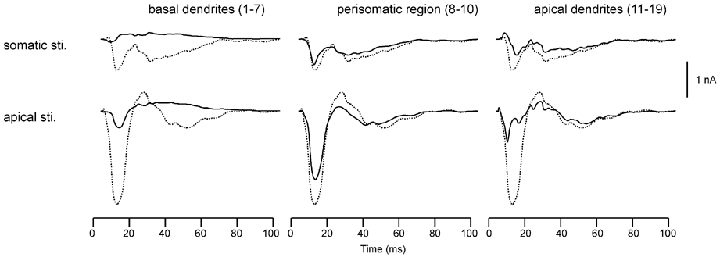
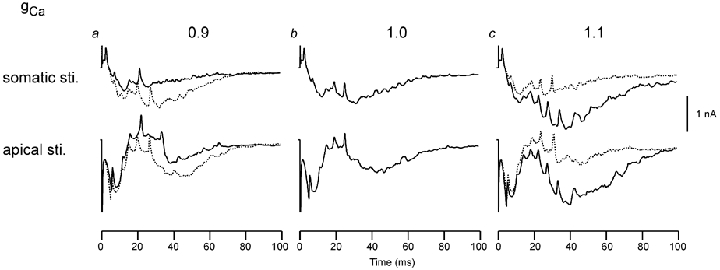
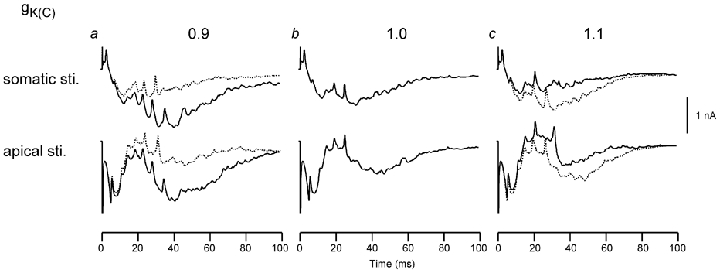
A mathematical model was used to analyse the contributions of different types of ionic currents in the pyramidal cells of longitudinal CA3 slices to the magnetic fields and field potentials generated by this preparation. Murakami et al. recently showed that a model based on the work of Traub et al. provides a quantitatively accurate account of the basic features of three types of empirical data (magnetic fields outside the slice, extracellular field potentials within the slice and intracellular potentials within the pyramidal neurons) elicited by stimulations of the soma and apical dendrites. This model was used in the present study to compute the net current dipole moment (Q) due to each of the different voltage- and ligand-gated channels in the cells in the presence of fast GABAA inhibition. These values of Q are proportional to the magnetic field and electrical potential far away from the slice. The intrinsic conductances were found to be more important than the synaptic conductances in determining the shape and magnitude of Q. Among the intrinsic conductances, the sodium (gNa) and delayed-rectifier potassium (gK(DR)) channels were found to produce sharp spikes. The high-threshold calcium channel (gCa) and C-type potassium channel (gK(C)) primarily determined the overall current waveforms. The roles of gCa and gK(C) were independent of small perturbations in these channel densities in the apical and basal dendrites. A combination of gNa, gK(DR), gCa, and gK(C) accounted for most of the evoked responses, except for later slow components, which were primarily due to synaptic channels.
Figures
Similar articles
-
A model of a CA3 hippocampal pyramidal neuron incorporating voltage-clamp data on intrinsic conductances.J Neurophysiol. 1991 Aug;66(2):635-50. doi: 10.1152/jn.1991.66.2.635. J Neurophysiol. 1991. PMID: 1663538
-
Physiological origins of evoked magnetic fields and extracellular field potentials produced by guinea-pig CA3 hippocampal slices.J Physiol. 2002 Oct 1;544(Pt 1):237-51. doi: 10.1113/jphysiol.2002.027094. J Physiol. 2002. PMID: 12356895 Free PMC article.
-
Contributions of principal neocortical neurons to magnetoencephalography and electroencephalography signals.J Physiol. 2006 Sep 15;575(Pt 3):925-36. doi: 10.1113/jphysiol.2006.105379. Epub 2006 Apr 13. J Physiol. 2006. PMID: 16613883 Free PMC article.
-
Voltage-dependent currents of vertebrate neurons and their role in membrane excitability.Adv Neurol. 1986;44:137-70. Adv Neurol. 1986. PMID: 2422889 Review.
-
The origin of extracellular fields and currents--EEG, ECoG, LFP and spikes.Nat Rev Neurosci. 2012 May 18;13(6):407-20. doi: 10.1038/nrn3241. Nat Rev Neurosci. 2012. PMID: 22595786 Free PMC article. Review.
Cited by
-
Invariance in current dipole moment density across brain structures and species: physiological constraint for neuroimaging.Neuroimage. 2015 May 1;111:49-58. doi: 10.1016/j.neuroimage.2015.02.003. Epub 2015 Feb 10. Neuroimage. 2015. PMID: 25680520 Free PMC article.
-
Saccadic preparation in the frontal eye field is modulated by distinct trial history effects as revealed by magnetoencephalography.Cereb Cortex. 2011 Feb;21(2):245-53. doi: 10.1093/cercor/bhq057. Epub 2010 Jun 3. Cereb Cortex. 2011. PMID: 20522539 Free PMC article.
-
Mechanisms of astrocytic K(+) clearance and swelling under high extracellular K(+) concentrations.J Physiol Sci. 2016 Mar;66(2):127-42. doi: 10.1007/s12576-015-0404-5. Epub 2015 Oct 27. J Physiol Sci. 2016. PMID: 26507417 Free PMC article.
-
High-frequency neural activity and human cognition: past, present and possible future of intracranial EEG research.Prog Neurobiol. 2012 Sep;98(3):279-301. doi: 10.1016/j.pneurobio.2012.06.008. Epub 2012 Jun 26. Prog Neurobiol. 2012. PMID: 22750156 Free PMC article. Review.
-
Neural Mechanisms Underlying Human Auditory Evoked Responses Revealed By Human Neocortical Neurosolver.Brain Topogr. 2022 Jan;35(1):19-35. doi: 10.1007/s10548-021-00838-0. Epub 2021 Apr 19. Brain Topogr. 2022. PMID: 33876329 Free PMC article.
References
-
- Barr RC, Pilkington TC, Boineau JP, Spach MS. Determining surface potentials from current dipoles, with application to electrocardiography. IEEE Trans Biomed Eng. 1966;13:88–92. - PubMed
-
- Geselowitz DB. On the magnetic field generated outside an in homogeneous volume conductor by internal current sources. IEEE Trans Magn. 1970;6:346–347.
-
- Hille B. Ionic Channels of Excitable Membranes. Sunderland Mass: Blackwell Science Inc; 2001.
-
- Johnston D, Magee JC, Colbert CM, Cristie BR. Active properties of neuronal dendrites. Annu Rev Neurosci. 1996;19:165–186. - PubMed
Publication types
MeSH terms
Substances
Grants and funding
LinkOut - more resources
Full Text Sources
Miscellaneous