. 2003 Oct 6;198(7):1069-76.
doi: 10.1084/jem.20030630.

Constitutive cytokine mRNAs mark natural killer (NK) and NK T cells poised for rapid effector function

Affiliations

Constitutive cytokine mRNAs mark natural killer (NK) and NK T cells poised for rapid effector function

Daniel B Stetson et al. J Exp Med. .

Abstract

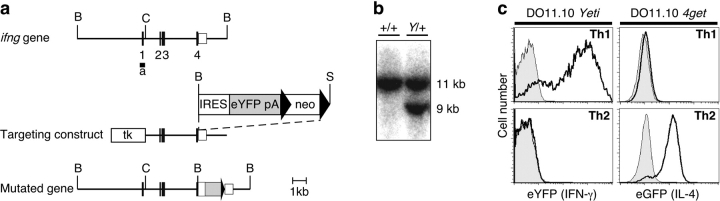
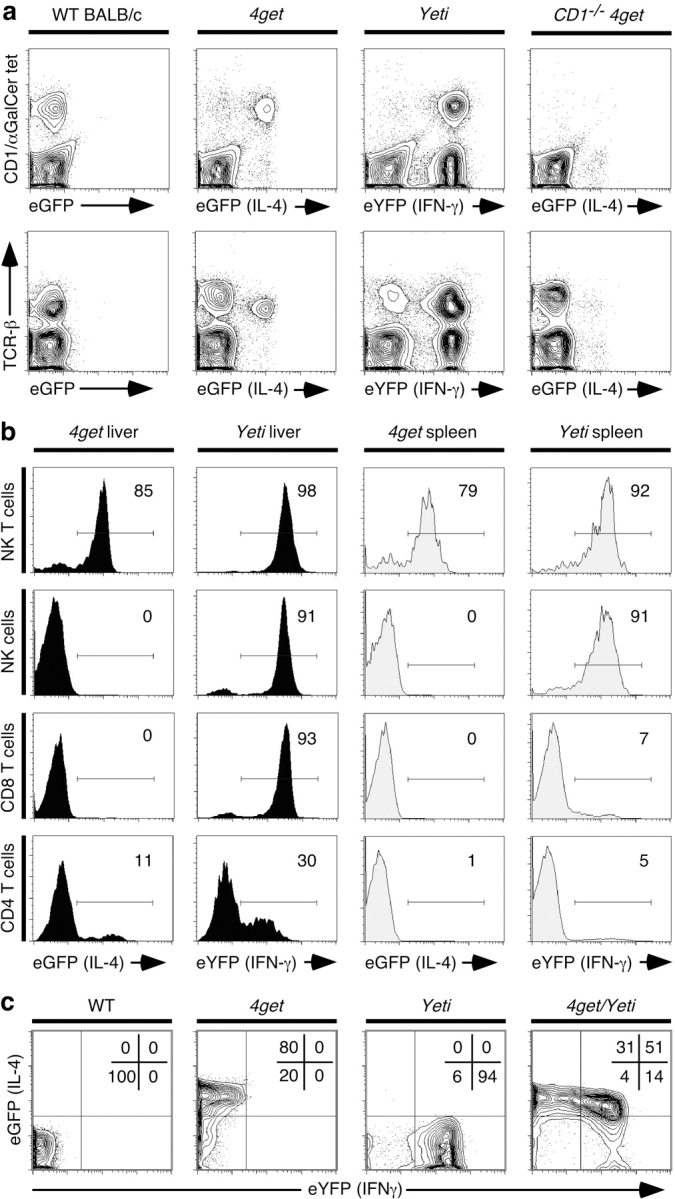
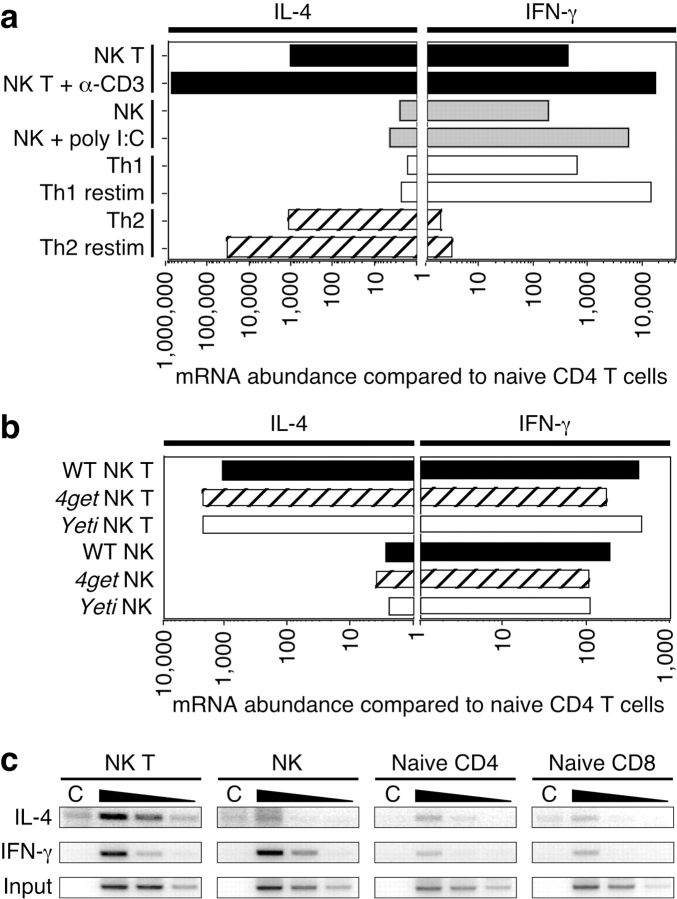
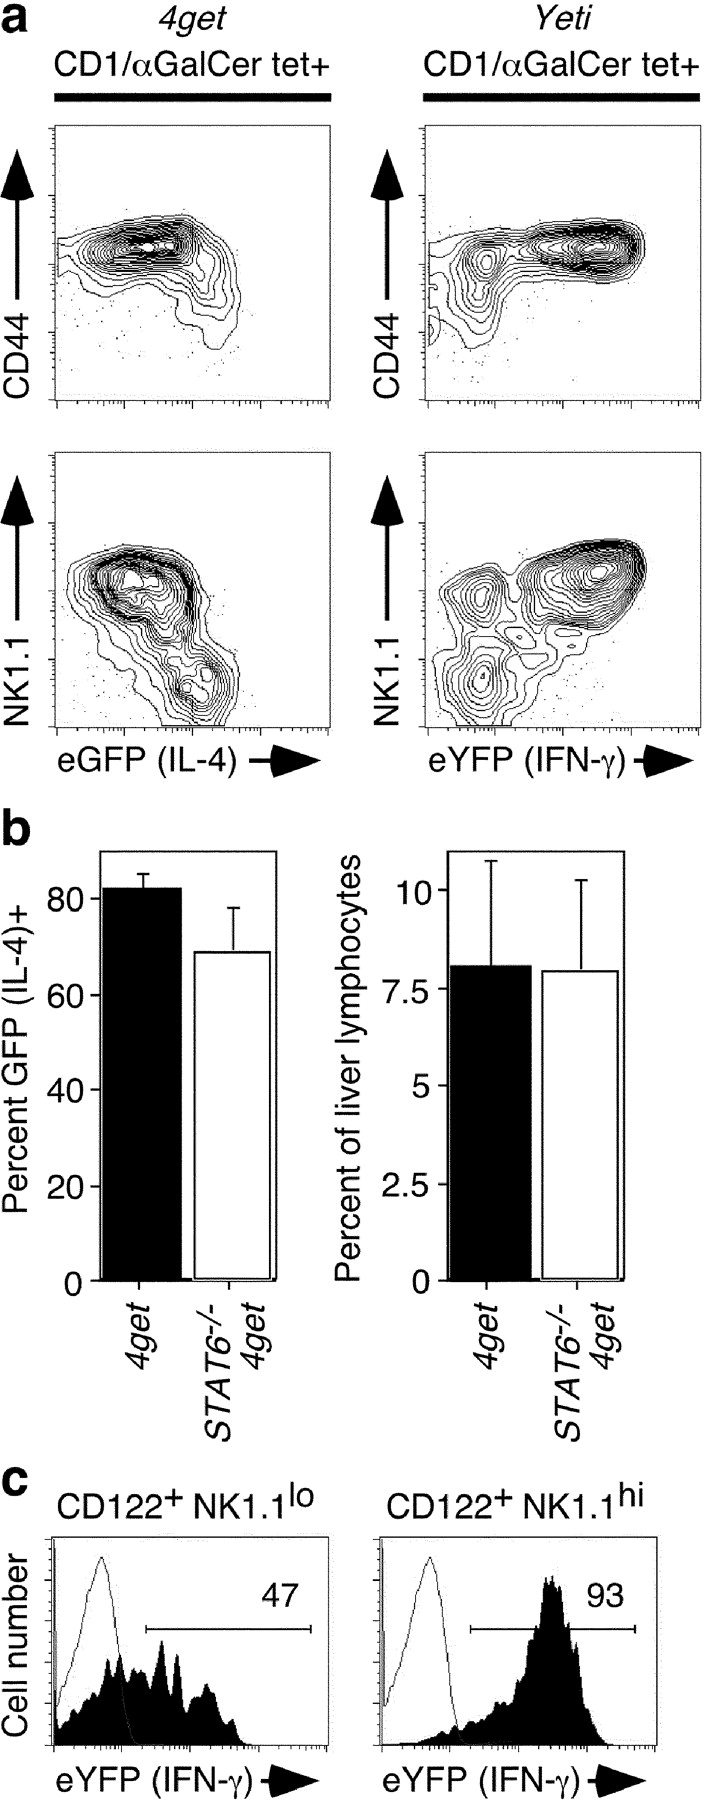
Natural killer (NK) and NK T cells are tissue lymphocytes that secrete cytokines rapidly upon stimulation. Here, we show that these cells maintain distinct patterns of constitutive cytokine mRNAs. Unlike conventional T cells, NK T cells activate interleukin (IL)-4 and interferon (IFN)-gamma transcription during thymic development and populate the periphery with both cytokine loci previously modified by histone acetylation. Similarly, NK cells transcribe and modify the IFN-gamma gene, but not IL-4, during developmental maturation in the bone marrow. Lineage-specific patterns of cytokine transcripts predate infection and suggest evolutionary selection for invariant but distinct types of effector responses among the earliest responding lymphocytes.


Figures

Figure 1.
Figure 1.
Characterization of eYFP expression in Yeti mice. (a) Map of the murine ifng locus, the targeting construct, and the mutated gene. A genomic fragment of the ifng gene was mutated by the addition of an IRES element, eYFP, and a polyadenylation signal (pA), followed by a loxP-flanked neomycin resistance (neo) cassette. Thymidine kinase (tk) was added upstream for counterselection. Cre-mediated recombination of the neomycin cassette in chimeric males resulted in the final mutated locus (bottom). Ifng exons are numbered and depicted as filled boxes. Southern probe (a) spans the first exon. BamHI (B), ClaI (C), and SacI (S) sites are indicated. (b) Genomic DNA from wild-type and targeted ES cell clones was digested with BamHI and blotted with probe (a) to detect the appearance of a 9-kb fragment corresponding to the mutated allele. (c) Naive T cells from DO11.10 Yeti (left) and DO11.10 4get mice (right) were stimulated with 100 nM ovalbumin peptide for 4 d under Th1 (top) or Th2 (bottom) conditions. Histograms with bold lines indicate eYFP expression in Yeti Th1 cells and eGFP expression in 4get Th2 cells. Wild-type DO11.10 controls are shown in gray.
Figure 2.
Figure 2.
Spontaneous fluorescence in liver lymphocytes of naive cytokine reporter mice. (a) Liver cells isolated from wild-type, 4get, Yeti, and CD1d / 4get mice were stained with CD1d/αGalCer tetramers and antibodies to TCRβ. The top displays CD1d/αGalCer tetramer staining versus the fluorescent cytokine reporter, and the bottom depicts TCRβ expression versus the fluorescent marker. FACS® plots represent 5% contours with outliers and are representative of 7–10 mice per group. (b) Liver and spleen cells were stained with phenotypic markers to identify major lymphocyte populations. The following phenotypes were used to identify the different cell populations: NK T cells: CD8 TCRβ1 CD1d/αGalCer tetramer+; NK cells: CD3 CD8 CD4 CD122+; CD8 T cells: CD4 CD1d/αGalCer tetramer TCRβ1 CD8+; and CD4 T cells: CD8 CD1d/αGalCer tetramer TCRβ1 CD4+. Histograms are representative of three experiments. The electronic gates were set to contain <1% of wild-type, non(auto)-fluorescent controls. (c) Liver NK T cells from wild-type, 4get, Yeti, and 4get/Yeti intercrossed mice were examined for eGFP versus eYFP fluorescence. Data are representative of four mice.
Figure 3.
Figure 3.
In situ localization of the NK T cell cytokine response. Spleen sections from untreated or anti-CD3–injected 4get mice were stained with antibodies to eGFP (green), IFN-γ or isotype control (red), and TCRβ (blue). DAPI fluorescence is in gray. (a) Untreated 4get spleen. ×100. (b) Anti-CD3–treated 4get spleen. ×100. (c) ×400 image of area indicated by the white box in b. Arrows indicate cells with costaining for eGFP and IFN-γ. (d) Isotype control staining for IFN-γ in the spleen of an anti-CD3–treated 4get mouse. Magnification of a and b is ×100 and ×400 c and d. Data are representative of two independent experiments.
Figure 4.
Figure 4.
Analysis of spontaneous cytokine mRNAs and chromatin modifications in wild-type NK T and NK cells. (a) NK T and NK cells (see Fig. 1 b for gating) were sorted from spleens of unimmunized C57BL/6 mice, from mice immunized intravenously 90 min earlier with 1.33 μg anti-CD3, or from mice injected intraperitoneally 4 h earlier with 150 μg poly I/C. 5′-nuclease fluorogenic RT-PCR was performed on isolated total RNA and the abundance of cytokine mRNA was normalized to HPRT message. This ratio was compared with the cytokine/HPRT ratio of highly purified, naive CD4 T cells sorted from lymph nodes of the same animals. Th1 and Th2 cells were generated by in vitro stimulation and restimulated with PMA and ionomycin for 3 h. Data are the average of three independently processed samples per group and are representative of two experiments. (b) NK T and NK cells were sorted from spleens of unimmunized wild-type, 4get, or Yeti mice. Cytokine mRNA abundance was determined as for Fig. 4 a. (c) 107 cells of the indicated populations were sorted from the spleens and lymph nodes of C57BL/6 mice. Chromatin immunoprecipitations were performed using control rabbit IgG (C) or antibodies to acetylated H3. PCR using primers to the IL-4 and IFN-γ promoters was performed on serial fivefold dilutions of DNA recovered from the experimental immunoprecipitation. Dilutions of input DNA were amplified with primers to the IFN-γ promoter to demonstrate comparable amounts of starting material.
Figure 5.
Figure 5.
Developmental activation of cytokine mRNAs in NK T and NK cells. (a) Thymi were isolated from 2-wk-old 4get and Yeti mice, and gated CD1d/αGalCer tetramer+ cells were examined for expression of CD44, NK1.1, and the fluorescent cytokine reporter. FACS® plots depict 5% probability contours with outliers and are representative of three mice from each group. (b) Liver lymphocytes were isolated from 4get mice or 4get × Stat6 −/− mice. On the left, the percentage of CD1d/αGalCer tetramer+ cells expressing eGFP (IL-4) was compared. On the right, the percentage of NK T cells in the liver was enumerated. Means and standard deviations are depicted for four mice per group. (c) Bone marrow cells were isolated from the femurs of 2-wk-old Yeti mice. NK lineage cells were identified as [CD3, TCRβ, CD4, CD8, B220] CD122+. eYFP (IFN-γ) expression was examined in NK1.1 and NK1.1+ NK lineage cells. Data are representative of five animals.

References

    1. Bendelac, A., M.N. Rivera, S.H. Park, and J.H. Roark. 1997. Mouse CD1-specific NK1 T cells: development, specificity, and function. Annu. Rev. Immunol. 15:535–562. - PubMed
    1. Cerwenka, A., and L.L. Lanier. 2001. Natural killer cells, viruses and cancer. Nat. Rev. Immunol. 1:41–49. - PubMed
    1. Arase, H., E.S. Mocarski, A.E. Campbell, A.B. Hill, and L.L. Lanier. 2002. Direct recognition of cytomegalovirus by activating and inhibitory NK cell receptors. Science. 296:1323–1326. - PubMed
    1. French, A.R., and W.M. Yokoyama. 2003. Natural killer cells and viral infections. Curr. Opin. Immunol. 15:45–51. - PubMed
    1. Biron, C.A., K.S. Byron, and J.L. Sullivan. 1989. Severe herpesvirus infections in an adolescent without natural killer cells. N. Engl. J. Med. 320:1731–1735. - PubMed

Publication types