. 2003 Oct 14;100(21):12319-24.
doi: 10.1073/pnas.1635114100. Epub 2003 Oct 6.

Systemic and cell type-specific gene expression patterns in scleroderma skin

Affiliations

Systemic and cell type-specific gene expression patterns in scleroderma skin

Michael L Whitfield et al. Proc Natl Acad Sci U S A. .

Abstract

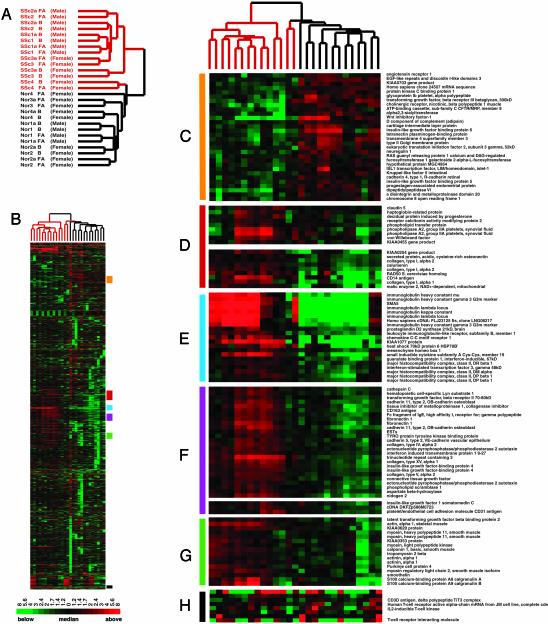
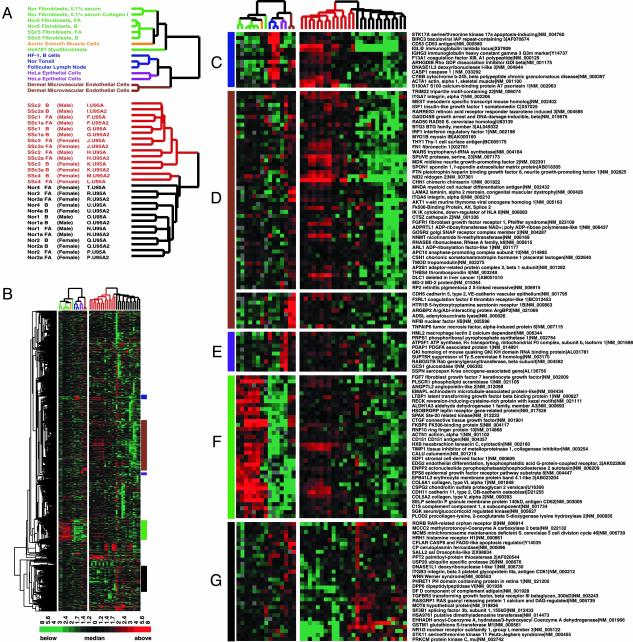
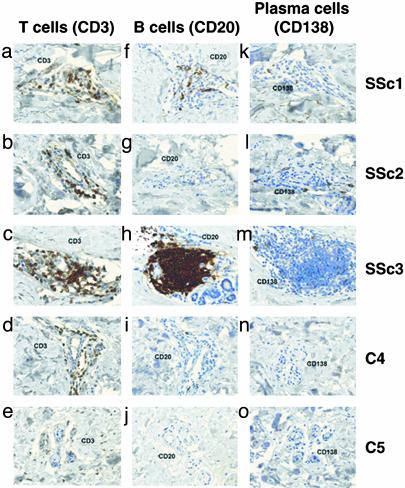
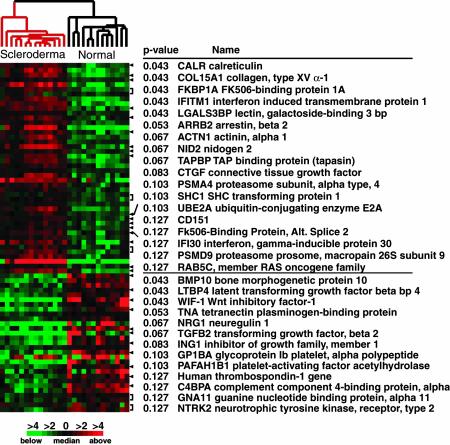
We used DNA microarrays representing >12,000 human genes to characterize gene expression patterns in skin biopsies from individuals with a diagnosis of systemic sclerosis with diffuse scleroderma. We found consistent differences in the patterns of gene expression between skin biopsies from individuals with scleroderma and those from normal, unaffected individuals. The biopsies from affected individuals showed nearly indistinguishable patterns of gene expression in clinically affected and clinically unaffected tissue, even though these were clearly distinguishable from the patterns found in similar tissue from unaffected individuals. Genes characteristically expressed in endothelial cells, B lymphocytes, and fibroblasts showed differential expression between scleroderma and normal biopsies. Analysis of lymphocyte populations in scleroderma skin biopsies by immunohistochemistry suggest the B lymphocyte signature observed on our arrays is from CD20+ B cells. These results provide evidence that scleroderma has systemic manifestations that affect multiple cell types and suggests genes that could be used as potential markers for the disease.


Figures

Fig. 1.
Fig. 1.
Gene expression in scleroderma skin biopsies. (A) The dendrogram representing four scleroderma (SSc) subjects is colored red, and the dendrogram for the four normal (nor) control subjects has been colored black. Samples taken from affected forearm (FA) or unaffected back (B) of SSc subjects and normal control subjects are indicated. (B) Overview of gene expression patterns indicating the select clusters of genes shown in more detail. (C) Normal cluster. (D) Collagen I cluster. (E) B lymphocyte cluster. (F) Cell adhesion and extracellular matrix. (G) Smooth muscle cluster. (H) T cell cluster.
Fig. 2.
Fig. 2.
Cell type-specific gene expression in scleroderma skin biopsies. Cell lines were used to define the cell lineage-specific gene expression observed in the skin biopsies. Gene expression data for SSc and normal (Nor) skin biopsies were collapsed by UniGene cluster ID. (A) The dendrogram for fibroblast cell lines is labeled green, muscle cell line is orange, lymphoid tissue and cell lines are blue, epithelial cells are purple, and endothelial cells are brown. (B) Overview of the 1,123 genes that change >2-fold on at least four arrays in the skin biopsy data; the colored bars to the right identify the location of the insets displayed in CG. (C) B lymphocyte gene expression cluster. (D) Endothelial gene expression cluster. (E) Epithelial gene expression cluster. (F) Fibroblasts gene expression cluster. (G) Normal gene expression cluster.
Fig. 3.
Fig. 3.
Immunohistochemistry for lymphocyte subsets in scleroderma skin. Lymphocyte subsets in forearm skin biopsies of three SSc patients (SSc1, SSc2, and SSc3) and two normal controls (C4 and C5) were investigated by immunohistochemistry. Paraffin sections were stained for T cells (CD3, ae), B cells (CD20, f and g), and plasma cells (CD138, ko). (Magnification: ×200.)
Fig. 4.
Fig. 4.
Genes differentially expressed between scleroderma and normal skin biopsies. A Wilcoxon rank sum test (19) was used to select genes that showed significant differences in expression between scleroderma skin biopsies and normal skin biopsies. Shown are the P values for each gene that have been corrected for multiple testing (P < 0.13). The full list of genes differentially expressed between scleroderma and normal biopsies is available in Fig. 6.

References

    1. Mayes, M. D. (1998) Semin. Cutan. Med. Surg. 17, 22–26. - PubMed
    1. Seibold, J. R. (2001) in Kelley's Textbook of Rheumatology, eds. Ruddy, S., Harris, E. D. & Sledge, C. B. (Saunders, Philadelphia), pp. 1211–1239.
    1. Steen, V. D. & Medsger, T. A., Jr. (2000) Arthritis Rheum. 43, 2437–2444. - PubMed
    1. Ferri, C., Valentini, G., Cozzi, F., Sebastiani, M., Michelassi, C., La Montagna, G., Bullo, A., Cazzato, M., Tirri, E., Storino, F., et al. (2002) Medicine (Baltimore) 81, 139–153. - PubMed
    1. Scussel-Lonzetti, L., Joyal, F., Raynauld, J. P., Roussin, A., Rich, E., Goulet, J. R., Raymond, Y. & Senecal, J. L. (2002) Medicine (Baltimore) 81, 154–167. - PubMed

Publication types