Extensive regional atmospheric hydrocarbon pollution in the southwestern United States
- PMID: 14530403
- PMCID: PMC218698
- DOI: 10.1073/pnas.1635258100
Extensive regional atmospheric hydrocarbon pollution in the southwestern United States
Abstract
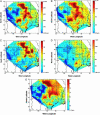
Light alkane hydrocarbons are present in major quantities in the near-surface atmosphere of Texas, Oklahoma, and Kansas during both autumn and spring seasons. In spring 2002, maximum mixing ratios of ethane [34 parts per 109 by volume (ppbv)], propane (20 ppbv), and n-butane (13 ppbv) were observed in north-central Texas. The elevated alkane mixing ratios are attributed to emissions from the oil and natural gas industry. Measured alkyl nitrate mixing ratios were comparable to urban smog values, indicating active photochemistry in the presence of nitrogen oxides, and therefore with abundant formation of tropospheric ozone. We estimate that 4-6 teragrams of methane are released annually within the region and represents a significant fraction of the estimated total U.S. emissions. This result suggests that total U.S. natural gas emissions may have been underestimated. Annual ethane emissions from the study region are estimated to be 0.3-0.5 teragrams.
Figures


References
-
- Finlayson-Pitts, B. & Pitts, J. (1997) Science 276, 1045–1052. - PubMed
-
- Atkinson, R. (2000) Atmos. Environ. 34, 2063–2101.
-
- Warneck, P. (1988) Chemistry of the Natural Atmosphere (Academic, San Diego).
-
- Harrison, M., Shires, T., Wessels, J. & Cowgill, R. (1997) Methane Emissions from the Natural Gas Industry (Environmental Protection Agency, Washington, DC), EPA/600/SR-96/080.
-
- Blake, D. R., Chen, T.-C., Smith, T. W., Jr., Wang, C. J.-L., Wingenter, O. W., Blake, N. J. & Rowland, F. S. (1996) J. Geophys. Res. 101, 1763–1778.
LinkOut - more resources
Full Text Sources

