Comparative Study
. 2003 Oct 15;31(20):5886-96.
doi: 10.1093/nar/gkg806.

Modulation of gene expression in Leishmania drug resistant mutants as determined by targeted DNA microarrays

Affiliations
Comparative Study

Modulation of gene expression in Leishmania drug resistant mutants as determined by targeted DNA microarrays

Chantal Guimond et al. Nucleic Acids Res. .

Abstract

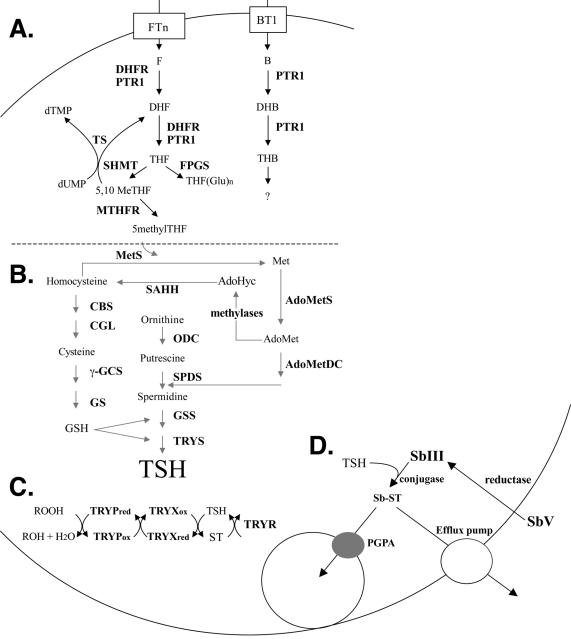
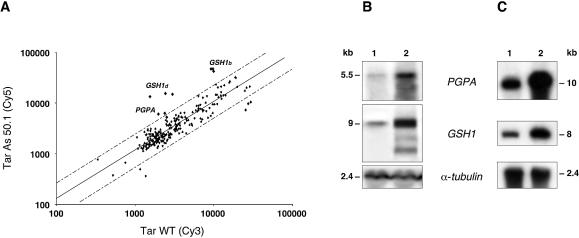
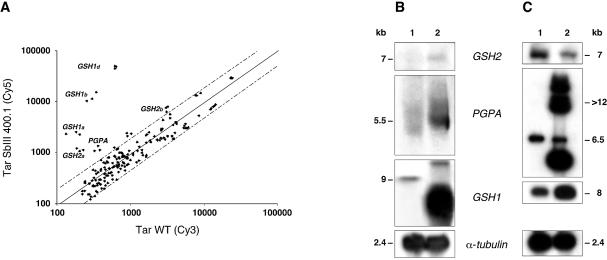
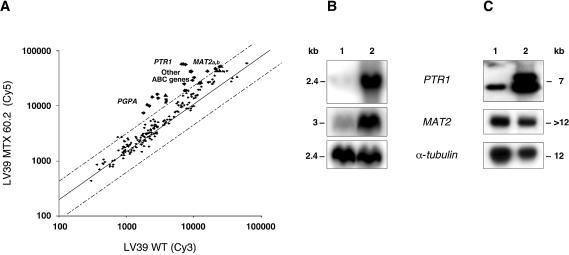
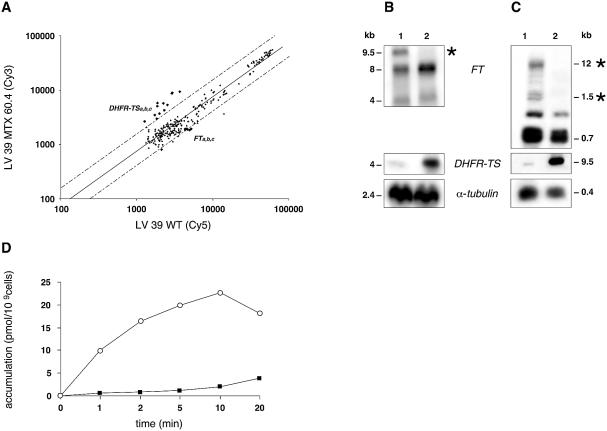
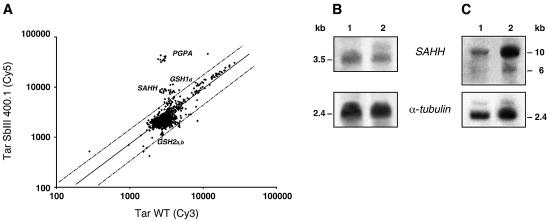
In the protozoan parasite Leishmania, drug resistance can be a complex phenomenon. Several metabolic pathways and membrane transporters are implicated in the resistance phenotype. To monitor the expression of these genes, we generated custom DNA microarrays with PCR fragments corresponding to 44 genes involved with drug resistance. Transcript profiling of arsenite and antimony resistant mutants with these arrays pinpointed a number of genes overexpressed in mutants, including the ABC transporter PGPA, the glutathione biosynthesis genes gamma-glutamylcysteine synthetase (GSH1) and the glutathione synthetase (GSH2). Competitive hybridisations with total RNA derived from sensitive and methotrexate resistant cells revealed the overexpression of genes coding for dihydrofolate reductase (DHFR-TS), pteridine reductase (PTR1) and S-adenosylmethionine synthase (MAT2) and a down regulation of one gene of the folate transporter (FT) family. By labelling the DNA of sensitive and resistant parasites we could also detect several gene amplification events using DNA microarrays including the amplification of the S-adenosyl homocysteine hydrolase gene (SAHH). Alteration in gene expression detected by microarrays was validated by northern blot analysis, while Southern blots indicated that most genes overexpressed were also amplified, although other mechanisms were also present. The microarrays were useful in the study of resistant parasites to pinpoint several genes linked to drug resistance.


Figures

Figure 1
Figure 1
Biochemical pathways of TSH and folate metabolism in Leishmania. (A) Folate and pterin metabolic pathways. (B) TSH biosynthetic pathway including selected aspects of cysteine and methionine pathways. (C) TSH-dependent peroxide reduction pathway. (D) Model for antimony resistance in Leishmania. All annotated genes involved in these pathways and their abbreviations are listed in Table 1 and were arrayed on DNA microarrays. F, DHF, THF, B, DHB and THB correspond to Folate and Biopterin and their Dihydro and Tetrahydro forms.
Figure 2
Figure 2
Gene expression analysis of the L.tarentolae As50.1 mutant as determined by DNA microarrays and northern blot analysis. (A) Scatter plot of hybridisation intensities between TarAs50.1 (Cy5) and wild-type L.tarentolae cells (Cy3). The expression of genes represented by dots within the dashed lines are considered as similar in the two tested strains. Dashed lines indicate 2-fold differences and genes whose expression differ significantly are indicated. (B) Confirmation of DNA microarray results by northern blot analysis showing that PGPA and GSH1 were overexpressed in the same mutant. Presumably, for genes grossly overexpressed, microarray results can only be qualitative as the signals are rapidly saturated. An α-tubulin hybridisation was performed to monitor RNA and DNA loading. For each figure we show one representative of several control gels used for the various genes. For quantification see Table 2. (C) Southern blot analysis to test whether increased RNA expression is mediated, at least in part, by gene amplification. The DNA of the parasites was digested with HindIII. 1, L.tarentolae wild-type cell; 2, TarII As50.1. Sizes were determined using the 1 kb Plus DNA ladder and the 0.24–9.5 kb RNA ladder from Invitrogen.
Figure 3
Figure 3
Gene expression analysis of the L.tarentolae TarIISbIII400.1 mutant as determined by DNA microarrays and northern blot analysis. (A) Scatter plot of hybridisation intensities between Tar SbIII400.1 (Cy5) and wild-type L.tarentolae cells (Cy3). Dashed lines indicate 2-fold differences. (B) Confirmation of DNA microarray results by northern blot analysis showing that PGPA, GSH1 and GSH2 are overexpressed. An α-tubulin hybridisation was performed to monitor RNA and DNA loading. For each figure we show one representative of several control gels used for the various genes. For quantification see Table 2. (C) Southern blot analysis to test whether increased RNA expression is mediated by gene amplification. The DNA of the parasites was digested with HindIII (blots hybridised to GSH2 and tubulin probes); EcoRI (blot hybridised to a GSH1 probe); and BamHI (blot hybridised to a PGPA probe). 1, Leishmania tarentolae wild-type cell; 2, TarIISbIII400.1. Sizes were determined using the 1 kb Plus DNA ladder and the 0.24–9.5 kb RNA ladder from Invitrogen.
Figure 4
Figure 4
Gene expression analysis of the L.major LV39 MTX60.2 mutant as determined by DNA microarrays and northern blot analysis. (A) Scatter plot of hybridisation intensities between LV39 MTX60.2 (Cy5) and wild-type L.major LV39 cells (Cy3). Dashed lines indicate 2-fold differences. A number of fragments spanning ABC transporter genes cross-hybridised to the overexpressed PGPA. (B) Confirmation of DNA microarray results by northern blot analysis showing overexpression of PTR1 and MAT2. An α-tubulin hybridisation was performed to monitor RNA and DNA loading. For quantification see Table 2. (C) Southern blot analysis to test whether increased RNA expression is mediated by gene amplification. The DNA of the parasites was digested with HindIII except for the blot hybridised to the PTR1 probe where the DNA was digested with SacI. 1, Leishmania major wild-type cell; 2, L.major LV39 MTX60.2. Sizes were determined using the 1 kb Plus DNA ladder and the 0.24–9.5 kb RNA ladder from Invitrogen.
Figure 5
Figure 5
Gene expression analysis of the L.major LV39 MTX60.4 mutant as determined by DNA microarrays and northern blot analysis. (A) Scatter plot of hybridisation intensities between LV39 MTX 60.4 (Cy3) and wild-type L.major LV39 cells (Cy5). Dashed lines indicate 2-fold limits. (B) Confirmation of DNA microarray results by northern blot analysis showing overexpression of DHFR-TS, while the expression of one member of the FT family labelled with an asterisk is repressed. An α-tubulin hybridisation was performed for the determination of equal RNA and DNA loading. For quantification see Table 2. (C) Southern blot analysis to test whether variation in RNA expression is mediated by variation in gene’s copy number. The DNA of the parasites was digested with SalI for the FT and α-tubulin blots and with SacI for the DHFR-TS blot. 1, Leishmania major wild-type cell; 2, L.major LV39 MTX60.4. Sizes were determined using the 1 kb Plus DNA ladder and the 0.24–9.5 kb RNA ladder from Invitrogen. (D) Transport experiment showing a decrease in MTX accumulation in the mutant LV39 MTX60.4 cells (filled squares) compared with wild-type L.major LV39 cells (open circles).
Figure 6
Figure 6
Gene amplification events in L.tarentolae TarIISbIII400.1 as determined by DNA microarrays. (A) Scatter plot of hybridisation intensities between TarIISbIII400.1 and wild-type digested total DNA and labelled, respectively, with Cy5 and Cy3. This corresponds to a second generation of array with 50 genes each spotted 12 times. Dots outside the dotted lines representing 2-fold differences suggest changes in copy number in the mutant. (B) Northern blot analysis of the SAHH gene. 1, Leishmania tarentolae wild-type cell; 2, TarIISbIII400.1. Sizes were determined using the 1 kb Plus DNA ladder and the 0.24–9.5 kb RNA ladder from Invitrogen. (C) The amplification of the SAHH gene in this mutant was confirmed by Southern blot of DNA digested with HindIII, while the other amplification events are shown in Figure 3.

References

    1. Herwaldt B.L. (1999) Leishmaniasis. Lancet, 354, 1191–1199. - PubMed
    1. Guerin P.J., Olliaro,P., Sundar,S., Boelaert,M., Croft,S.L., Desjeux,P., Wasunna,M.K. and Bryceson,A.D. (2002) Visceral leishmaniasis: current status of control, diagnosis and treatment and a proposed research and development agenda. Lancet Infect. Dis., 2, 494–501. - PubMed
    1. Sundar S., More,D.K., Singh,M.K., Singh,V.P., Sharma,S., Makharia,A., Kumar,P.C. and Murray,H.W. (2000) Failure of pentavalent antimony in visceral leishmaniasis in India: report from the Center of the Indian Epidemic. Clin. Infect. Dis., 31, 1104–1107. - PubMed
    1. Ouellette M. and Ward,S. (2002) Drug resistance in parasites. In Marr,J., Nielsen,T. and Komuniecki,R. (eds), Molecular Medical Parasitology. Academic Press, San Diego, pp. 395–430.
    1. Shaked-Mishan P., Ulrich,N., Ephros,M. and Zilberstein,D. (2001) Novel intracellular SbV reducing activity correlates with antimony susceptibility in Leishmania donovani. J. Biol. Chem., 276, 3971–3976. - PubMed

Publication types

MeSH terms