. 2003 Oct 15;31(20):6053-61.
doi: 10.1093/nar/gkg787.

Detection of regulatory circuits by integrating the cellular networks of protein-protein interactions and transcription regulation

Affiliations

Detection of regulatory circuits by integrating the cellular networks of protein-protein interactions and transcription regulation

Esti Yeger-Lotem et al. Nucleic Acids Res. .

Abstract

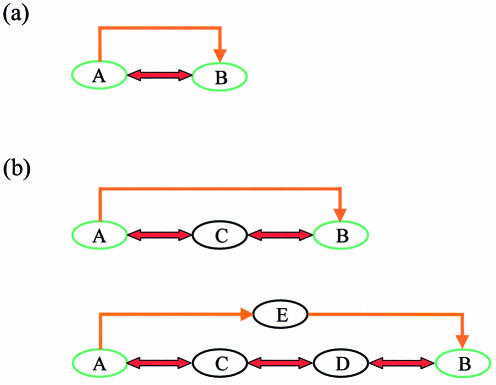
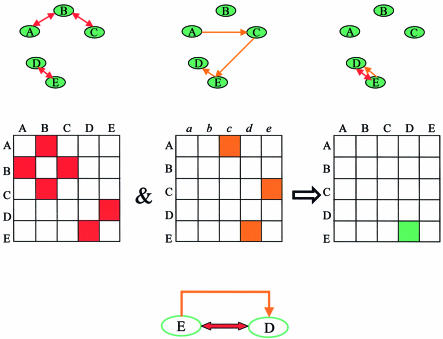
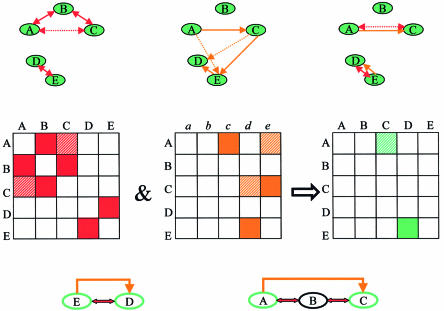
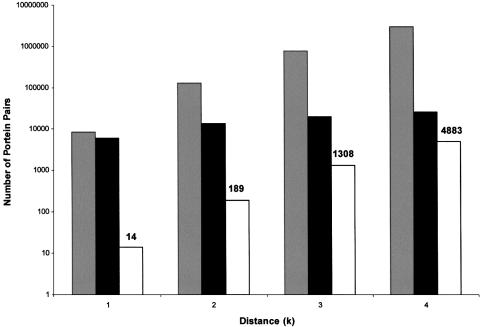
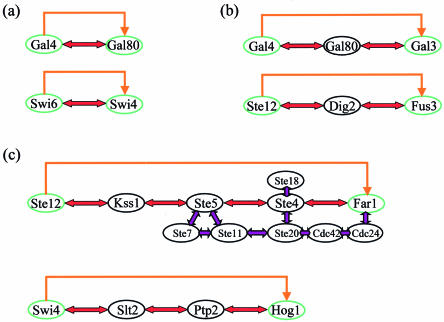
The post-genomic era is marked by huge amounts of data generated by large-scale functional genomic and proteomic experiments. A major challenge is to integrate the various types of genome-scale information in order to reveal the intra- and inter- relationships between genes and proteins that constitute a living cell. Here we present a novel application of classical graph algorithms to integrate the cellular networks of protein-protein interactions and transcription regulation. We demonstrate how integration of these two networks enables the discovery of simple as well as complex regulatory circuits that involve both protein-protein and protein-DNA interactions. These circuits may serve for positive or negative feedback mechanisms. By applying our approach to data from the yeast Saccharomyces cerevisiae, we were able to identify known simple and complex regulatory circuits and to discover many putative circuits, whose biological relevance has been assessed using various types of experimental data. The newly identified relations provide new insight into the processes that take place in the cell, insight that could not be gained by analyzing each type of data independently. The computational scheme that we propose may be used to integrate additional functional genomic and proteomic data and to reveal other types of relations, in yeast as well as in higher organisms.


Figures

Figure 1
Figure 1
Regulatory circuits defined by proteins A and B. A red bi-directional arrow marks protein–protein interaction, and an orange arrow marks transcription regulation. (a) A direct regulatory circuit consists of two proteins, where protein A regulates gene b, and the product of gene b, protein B, interacts with A. Such a circuit can be used for feedback regulation or for switching on a new pathway. In the former, the interaction between A and B prevents A from activating the transcription of the gene encoding protein B, and by this maintains the required level of B. In the latter, the complex AB can be used to activate a new set of genes. In both cases, the circuit serves as the switch that controls the activity of A. (b) Higher order regulatory circuits can be identified between proteins that are indirectly related. These circuits contain intermediate proteins between A and B that either form a series of protein–protein interactions, or a series of regulator–target interactions. In the upper circuit, proteins A and B are related via protein C that interacts with both A and B. In the lower circuit, proteins A and B are related via proteins C and D, and via transcription factor E that is regulated by A and in turn regulates the gene encoding protein B.
Figure 2
Figure 2
The computational approach for integration of protein–protein and protein–DNA interaction data. (Top) From left to right, the protein–protein interaction graph, the regulator–target relationship graph and the intersection graph. The intersection graph contains a regulatory circuit between E and D. (Middle) The same information using matrix representation is depicted. The protein–protein interaction data are represented by the left-most symmetric adjacency matrix, where red-filled entries mark pairs of interacting proteins [(A,B), (B,C) and (D,E)]. The regulator–target interaction data are represented in the middle adjacency matrix, where orange-filled entries mark regulator–target relationships [(A,c), (C,e) and (E,d)]. Co-occupied entries in the two matrices correspond to protein pairs that are related to each other both by protein–protein interaction and regulator–target relationship, and are revealed by intersecting the two matrices. These co-occupied entries determine the circuits. The resulting intersection matrix is shown on the right, where the green-filled entry marks the pair (E,D) that defines a regulatory circuit (bottom).
Figure 3
Figure 3
Detection of regulatory circuits of order 2. (Top) From left to right, the protein–protein interaction graph, the regulator–target relationship graph and the intersection graph. In each graph a directed solid edge connects two nodes if the corresponding proteins interact. A directed dotted edge from one node to another exists if a path composed of two solid edges leads from the first node to the other. For example, in the protein–protein interaction graph a dotted edge connects A and C since they are connected by a path A–B–C of length 2. (We ignore paths of the form A–B–A that use the same edge twice in the protein–protein interaction graph.) The intersection graph contains two regulatory circuits, between E and D, and between A and C. (Middle) The graphs as adjacency matrices. As in Figure 2, filled entries mark protein pairs that are connected by a solid edge in the original graphs. By multiplication of each matrix by itself, higher order relations between proteins may be detected. These relations are noted as striped entries in the red and orange matrices (and represent the dotted edges in the corresponding graphs). Entries that are co-occupied in the red and orange matrices are colored green in the intersection matrix: the entries are filled if both corresponding entries are filled, and striped if at least one entry is striped. (Bottom) The resulting regulatory circuits. The regulatory circuits between E and D and between A and C are of orders 1 and 2, respectively.
Figure 4
Figure 4
Number of connected protein pairs. Gray bars, protein pairs whose distance in the graph of physical interactions ≤k; black bars, protein pairs whose distance in the regulator–target graph ≤k; white bars, protein pairs defining circuits of order k (based on the intersection graphs). The numbers on the y-axis are presented on a logarithmic scale.
Figure 5
Figure 5
Detected regulatory circuits. (a) Known direct regulatory circuits. Gal4–Gal80 comprises a negative feedback circuit (see text). The Swi6–Swi4 circuit functions to switch on a new pathway: the transcription of SWI4 depends on Swi6. The complex Swi4–Swi6 (called SBF) is responsible for the transcription of SWI4 as well as for the synthesis of other genes that function in late G1, thus enabling the progression of the cell cycle (23,24). (b) Known regulatory circuits of order 2 (see text). (c) Regulatory circuits of higher orders. Ste12 and Far1 define a known regulatory circuit of order 4 that is part of the mating pheromone response pathway (28) and Swi4 and Hog1 define a putative regulatory circuit of order 3. In the Ste12–Far1 circuit, purple arrows mark protein–protein interactions that are part of the known circuit, but are not detected by our method since we are looking for the shortest path between Ste12 and Far1. A complex of Ste4–Ste18 released from activated pheromone receptors recruits three essential regulators to the plasma membrane, and tethers them in close juxtaposition: a scaffold protein, Far1, that carries the guanine nucleotide exchange factor (Cdc24) for the Cdc42 small GTPase; a Cdc42-activated protein kinase Ste20; and a scaffold protein, Ste5, that carries the three-tiered module of protein kinases (Ste11, Ste7, Fus3). The close juxtaposition enables the following interaction series, Cdc24–Cdc42–Ste20–Ste11–Ste7–Kss1–Ste12, which results in the activation of Ste12. The activated Ste12 is a transcription factor of FAR1, as well as of many other genes involved in the pheromone response pathway. (Conventionally, the pathway is described by the interactions of proteins Fus3 and Dig1/Dig2 with Ste12 instead of Kss1, and we would have detected it if we did not look for the shortest path.) For the Swi4–Hog1 circuit, see text.

References

    1. DeRisi J.L., Iyer,V.R. and Brown,P.O. (1997) Exploring the metabolic and genetic control of gene expression on a genomic scale. Science, 278, 680–686. - PubMed
    1. Roth F.P., Hughes,J.D., Estep,P.W. and Church,G.M. (1998) Finding DNA regulatory motifs within unaligned noncoding sequences clustered by whole-genome mRNA quantitation. Nat. Biotechnol., 16, 939–945. - PubMed
    1. Marcotte E.M., Pellegrini,M., Thompson,M.J., Yeates,T.O. and Eisenberg,D. (1999) A combined algorithm for genome-wide prediction of protein function. Nature, 402, 83–86. - PubMed
    1. Drawid A., Jansen,R. and Gerstein,M. (2000) Genome-wide analysis relating expression level with protein subcellular localization. Trends Genet., 16, 426–430. - PubMed
    1. Ge H., Liu,Z., Church,G.M. and Vidal,M. (2001) Correlation between transcriptome and interactome mapping data from Saccharomyces cerevisiae.Nature Genet., 29, 482–486. - PubMed

Publication types