Membrane fluidity adjustments in ethanol-stressed Oenococcus oeni cells
- PMID: 14532031
- PMCID: PMC201238
- DOI: 10.1128/AEM.69.10.5826-5832.2003
Membrane fluidity adjustments in ethanol-stressed Oenococcus oeni cells
Abstract
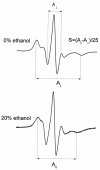
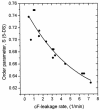
The effect of ethanol on the cytoplasmic membrane of Oenococcus oeni cells and the role of membrane changes in the acquired tolerance to ethanol were investigated. Membrane tolerance to ethanol was defined as the resistance to ethanol-induced leakage of preloaded carboxyfluorescein (cF) from cells. To probe the fluidity of the cytoplasmic membrane, intact cells were labeled with doxyl-stearic acids and analyzed by electron spin resonance spectroscopy. Although the effect of ethanol was noticeable across the width of the membrane, we focused on fluidity changes at the lipid-water interface. Fluidity increased with increasing concentrations of ethanol. Cells responded to growth in the presence of 8% (vol/vol) ethanol by decreasing fluidity. Upon exposure to a range of ethanol concentrations, these adapted cells had reduced fluidity and cF leakage compared with cells grown in the absence of ethanol. Analysis of the membrane composition revealed an increase in the degree of fatty acid unsaturation and a decrease in the total amount of lipids in the cells grown in the presence of 8% (vol/vol) ethanol. Preexposure for 2 h to 12% (vol/vol) ethanol also reduced membrane fluidity and cF leakage. This short-term adaptation was not prevented in the presence of chloramphenicol, suggesting that de novo protein synthesis was not involved. We found a strong correlation between fluidity and cF leakage for all treatments and alcohol concentrations tested. We propose that the protective effect of growth in the presence of ethanol is, to a large extent, based on modification of the physicochemical state of the membrane, i.e., cells adjust their membrane permeability by decreasing fluidity at the lipid-water interface.
Figures


Similar articles
-
Flow cytometric assessment of membrane integrity of ethanol-stressed Oenococcus oeni cells.Appl Environ Microbiol. 2002 Dec;68(12):6087-93. doi: 10.1128/AEM.68.12.6087-6093.2002. Appl Environ Microbiol. 2002. PMID: 12450832 Free PMC article.
-
Effect of adaptation to ethanol on cytoplasmic and membrane protein profiles of Oenococcus oeni.Appl Environ Microbiol. 2004 May;70(5):2748-55. doi: 10.1128/AEM.70.5.2748-2755.2004. Appl Environ Microbiol. 2004. PMID: 15128528 Free PMC article.
-
Membrane fluidity of stressed cells of Oenococcus oeni.Int J Food Microbiol. 2000 Apr 10;55(1-3):269-73. doi: 10.1016/s0168-1605(00)00202-6. Int J Food Microbiol. 2000. PMID: 10791756
-
Regulation of stress response in Oenococcus oeni as a function of environmental changes and growth phase.Int J Food Microbiol. 2000 Apr 10;55(1-3):27-31. doi: 10.1016/s0168-1605(00)00209-9. Int J Food Microbiol. 2000. PMID: 10791713 Review.
-
Ethanol stress in Oenococcus oeni: transcriptional response and complex physiological mechanisms.J Appl Microbiol. 2018 Jul;125(1):2-15. doi: 10.1111/jam.13711. Epub 2018 Mar 7. J Appl Microbiol. 2018. PMID: 29377375 Review.
Cited by
-
Competitive Traits Are More Important than Stress-Tolerance Traits in a Cadmium-Contaminated Rhizosphere: A Role for Trait Theory in Microbial Ecology.Front Microbiol. 2018 Feb 12;9:121. doi: 10.3389/fmicb.2018.00121. eCollection 2018. Front Microbiol. 2018. PMID: 29483898 Free PMC article.
-
Growth and consumption of L-malic acid in wine-like medium by acclimated and non-acclimated cultures of Patagonian Oenococcus oeni strains.Folia Microbiol (Praha). 2016 Sep;61(5):365-73. doi: 10.1007/s12223-016-0446-y. Epub 2016 Jan 23. Folia Microbiol (Praha). 2016. PMID: 26801155
-
The Influence of Alcohol Consumption on Intestinal Nutrient Absorption: A Comprehensive Review.Nutrients. 2023 Mar 24;15(7):1571. doi: 10.3390/nu15071571. Nutrients. 2023. PMID: 37049411 Free PMC article. Review.
-
Phase-transfer energetics of small-molecule alcohols across the water-hexane interface: molecular dynamics simulations using charge equilibration models.J Mol Graph Model. 2011 Apr;29(6):876-87. doi: 10.1016/j.jmgm.2010.09.005. Epub 2010 Oct 1. J Mol Graph Model. 2011. PMID: 21414823 Free PMC article.
-
Assessment of the genetic polymorphism and physiological characterization of indigenous Oenococcus oeni strains isolated from Aglianico del Vulture red wine.Folia Microbiol (Praha). 2016 Jan;61(1):1-10. doi: 10.1007/s12223-015-0402-2. Epub 2015 May 28. Folia Microbiol (Praha). 2016. PMID: 26016849
References
-
- Alexandre, H., I. Rousseaux, and C. Charpentier. 1994. Relationship between ethanol tolerance, lipid composition and plasma membrane fluidity in Saccharomyces cerevisiae and Kloekera apiculata. FEMS Microbiol. Lett. 124:17-22. - PubMed
-
- Barry, J. A., and K. Gawrisch. 1994. Direct NMR evidence for ethanol binding to the lipid-water interface of phospholipid bilayers. Biochemistry 33:8082-8088. - PubMed
-
- Baskaran, S., H. J. Ahn, and L. R. Lynd. 1995. Investigation of ethanol tolerance of Clostridium thermosaccharolyticum in continuous culture. Biotechnol. Prog. 11:276-281.
-
- Bligh, E. C., and W. J. Dyer. 1959. A rapid method of total lipid extracting and purification. Can. J. Biochem. Physiol. 37:911-917. - PubMed
Publication types
MeSH terms
Substances
LinkOut - more resources
Full Text Sources

