

Comparing denitrification estimates for a Texas estuary by using acetylene inhibition and membrane inlet mass spectrometry
- PMID: 14532049
- PMCID: PMC201219
- DOI: 10.1128/AEM.69.10.5950-5956.2003
Comparing denitrification estimates for a Texas estuary by using acetylene inhibition and membrane inlet mass spectrometry
Abstract
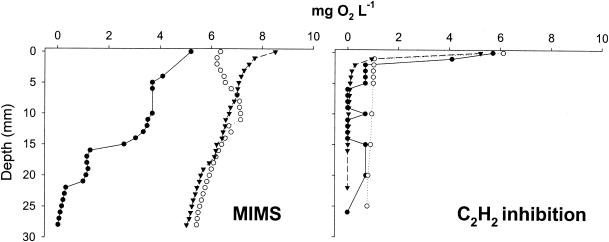
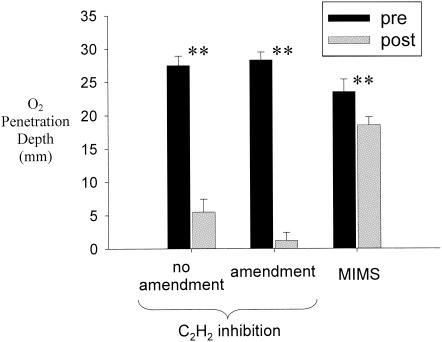
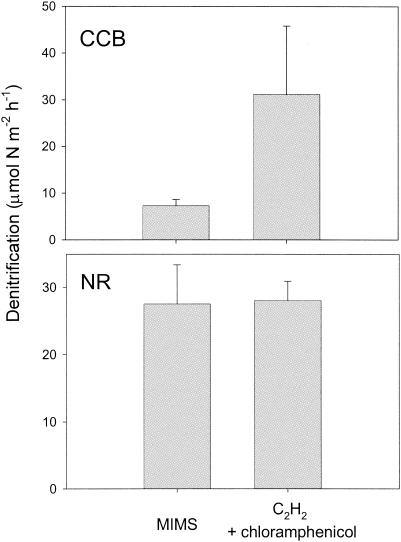
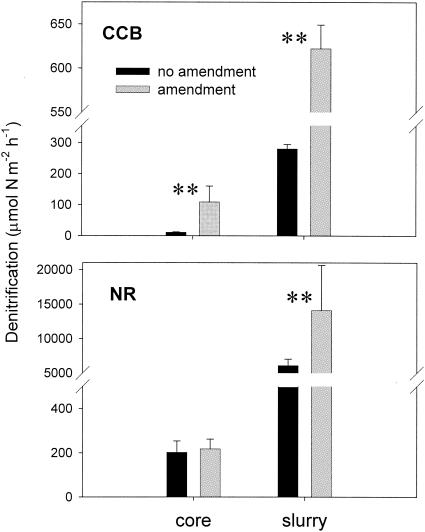
Characterizing denitrification rates in aquatic ecosystems is essential to understanding how systems may respond to increased nutrient loading. Thus, it is important to ensure the precision and accuracy of the methods employed for measuring denitrification rates. The acetylene (C2H2) inhibition method is a simple technique for estimating denitrification. However, potential problems, such as inhibition of nitrification and incomplete inhibition of nitrous oxide reduction, may influence rate estimates. Recently, membrane inlet mass spectrometry (MIMS) has been used to measure denitrification in aquatic systems. Comparable results were obtained with MIMS and C2H2 inhibition methods when chloramphenicol was added to C2H2 inhibition assay mixtures to inhibit new synthesis of denitrifying enzymes. Dissolved-oxygen profiles indicated that surface layers of sediment cores subjected to the MIMS flowthrough incubation remained oxic whereas cores incubated using the C2H2 inhibition methods did not. Analysis of the microbial assemblages before and after incubations indicated significant changes in the sediment surface populations during the long flowthrough incubation for MIMS analysis but not during the shorter incubation used for the C2H2 inhibition method. However, bacterial community changes were also small in MIMS cores at the oxygen transition zone where denitrification occurs. The C2H2 inhibition method with chloramphenicol addition, conducted over short incubation intervals, provides a cost-effective method for estimating denitrification, and rate estimates are comparable to those obtained by the MIMS method.
Figures
References
-
- Andersen, J. M. 1977. Rates of denitrification of undisturbed sediment from six lakes as a function of nitrate concentration, oxygen and temperature. Arch. Hydrobiol. 80:147-159.
-
- Atlas, R. M., and R. Bartha. 1998. Microbial ecology: fundamentals and applications. Benjamin Cummings, Menlo Park, Calif.
-
- Bergsma, T. T., N. E. Ostrom, M. Emmons, and G. P. Robertson. 2001. Measuring simultaneous fluxes from soil of N2O and N2 in the field using the 15N-gas “nonequilibrium” technique. Environ. Sci. Technol. 35:4307-4312. - PubMed
Publication types
MeSH terms
Substances
LinkOut - more resources
Full Text Sources
