

Escherichia coli ghost production by expression of lysis gene E and Staphylococcal nuclease
- PMID: 14532068
- PMCID: PMC201253
- DOI: 10.1128/AEM.69.10.6106-6113.2003
Escherichia coli ghost production by expression of lysis gene E and Staphylococcal nuclease
Abstract
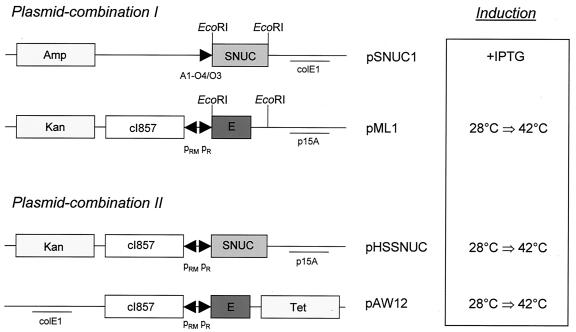
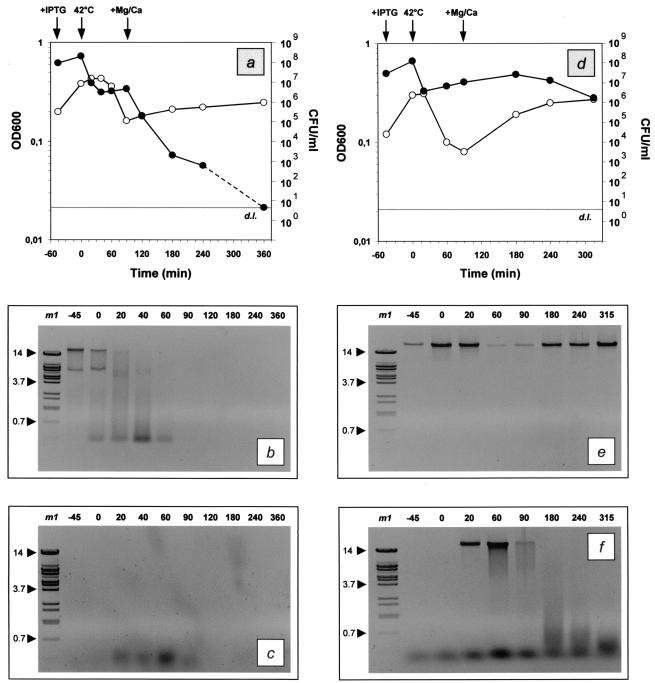
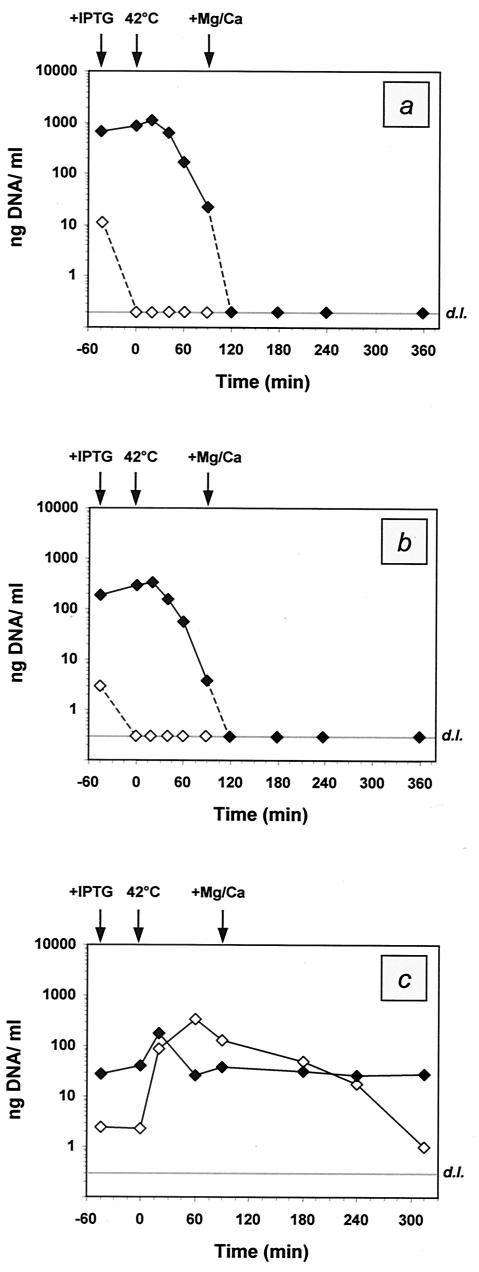
The production of bacterial ghosts from Escherichia coli is accomplished by the controlled expression of phage phiX174 lysis gene E and, in contrast to other gram-negative bacterial species, is accompanied by the rare detection of nonlysed, reproductive cells within the ghost preparation. To overcome this problem, the expression of a secondary killing gene was suggested to give rise to the complete genetic inactivation of the bacterial samples. The expression of staphylococcal nuclease A in E. coli resulted in intracellular accumulation of the protein and degradation of the host DNA into fragments shorter than 100 bp. Two expression systems for the nuclease are presented and were combined with the protein E-mediated lysis system. Under optimized conditions for the coexpression of gene E and the staphylococcal nuclease, the concentration of viable cells fell below the lower limit of detection, whereas the rates of ghost formation were not affected. With regard to the absence of reproductive cells from the ghost fractions, the reduction of viability could be determined as being at least 7 to 8 orders of magnitude. The lysis process was characterized by electrophoretic analysis and absolute quantification of the genetic material within the cells and the culture supernatant via real-time PCR. The ongoing degradation of the bacterial nucleic acids resulted in a continuous quantitative clearance of the genetic material associated with the lysing cells until the concentrations fell below the detection limits of either assay. No functional, released genetic units (genes) were detected within the supernatant during the lysis process, including nuclease expression.
Figures
Similar articles
-
Generation of Vibrio anguillarum ghost by coexpression of PhiX 174 lysis E gene and staphylococcal nuclease A gene.Mol Biotechnol. 2009 Jun;42(2):154-9. doi: 10.1007/s12033-009-9147-y. Epub 2009 Feb 4. Mol Biotechnol. 2009. PMID: 19191038
-
Efficient production of safety-enhanced Escherichia coli ghosts by tandem expression of PhiX 174 mutant gene E and staphylococcal nuclease A gene.Microbiol Res. 2015 Jul;176:7-13. doi: 10.1016/j.micres.2015.03.011. Epub 2015 Mar 21. Microbiol Res. 2015. PMID: 26070687
-
A novel dual vector coexpressing PhiX174 lysis E gene and staphylococcal nuclease A gene on the basis of lambda promoter pR and pL, respectively.Mol Biotechnol. 2013 Jun;54(2):436-44. doi: 10.1007/s12033-012-9581-0. Mol Biotechnol. 2013. PMID: 22782703
-
Bacterial ghosts: non-living candidate vaccines.J Biotechnol. 1996 Jan 26;44(1-3):161-70. doi: 10.1016/0168-1656(95)00123-9. J Biotechnol. 1996. PMID: 8717400 Review.
-
Bacterial ghosts as carrier and targeting systems for mucosal antigen delivery.Expert Rev Vaccines. 2003 Feb;2(1):45-51. doi: 10.1586/14760584.2.1.45. Expert Rev Vaccines. 2003. PMID: 12901596 Review.
Cited by
-
A novel protocol for bacterial ghosts' preparation using tween 80.Saudi Pharm J. 2018 Feb;26(2):232-237. doi: 10.1016/j.jsps.2017.12.006. Epub 2017 Dec 13. Saudi Pharm J. 2018. PMID: 30166921 Free PMC article.
-
The Bacterial Ghost platform system: production and applications.Bioeng Bugs. 2010 Sep-Oct;1(5):326-36. doi: 10.4161/bbug.1.5.12540. Bioeng Bugs. 2010. PMID: 21326832 Free PMC article. Review.
-
Generation of Vibrio anguillarum ghost by coexpression of PhiX 174 lysis E gene and staphylococcal nuclease A gene.Mol Biotechnol. 2009 Jun;42(2):154-9. doi: 10.1007/s12033-009-9147-y. Epub 2009 Feb 4. Mol Biotechnol. 2009. PMID: 19191038
-
Bacterial ghost of avian pathogenic E. coli (APEC) serotype O78:K80 as a homologous vaccine against avian colibacillosis.PLoS One. 2018 Mar 22;13(3):e0194888. doi: 10.1371/journal.pone.0194888. eCollection 2018. PLoS One. 2018. PMID: 29566080 Free PMC article.
-
A novel autolysis system for extracellular production and direct immobilization of a phospholipase D fused with cellulose binding domain.BMC Biotechnol. 2019 May 22;19(1):29. doi: 10.1186/s12896-019-0519-5. BMC Biotechnol. 2019. PMID: 31118018 Free PMC article.
References
-
- Alexander, M., L. A. Heppel, and J. Hurwitz. 1961. The purification and properties of micrococcal nuclease. J. Biol. Chem. 236:3014-3019. - PubMed
-
- Anfinsen, C. B., P. Cuatrecasas, and H. Taniuchi. 1971. Staphylococcal nuclease: chemical properties and catalysis, p. 177-201. In P. Boyer (ed.), The enzymes, vol. 4. Academic Press, New York, N.Y.
-
- Bolivar, F., R. L. Rodriguez, P. J. Greene, M. C. Betlach, H. L. Heyneker, and H. W. Boyer. 1977. Construction and characterization of new cloning vehicles. II. A multipurpose cloning system. Gene 2:95-113. - PubMed
-
- Boynton, Z. L., J. J. Koon, E. M. Brennan, J. D. Clouart, D. M. Horowitz, T. U. Gerngross, and G. W. Huisman. 1999. Reduction of cell viscosity during processing of poly(3-hydroxyalkanoates) by chromosomal integration of the staphylococcal nuclease gene in Pseudomonas putida. Appl. Environ. Microbiol. 65:1524-1529. - PMC - PubMed
MeSH terms
Substances
LinkOut - more resources
Full Text Sources
Other Literature Sources
