

Comparison of velocity profiles for different flow chamber designs used in studies of microbial adhesion to surfaces
- PMID: 14532092
- PMCID: PMC201240
- DOI: 10.1128/AEM.69.10.6280-6287.2003
Comparison of velocity profiles for different flow chamber designs used in studies of microbial adhesion to surfaces
Abstract
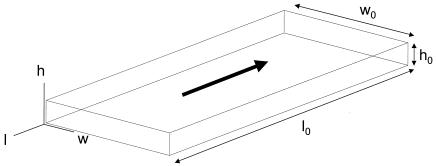
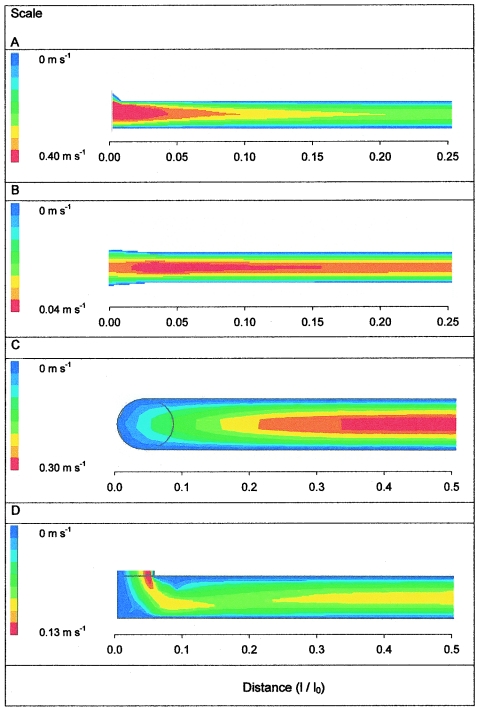
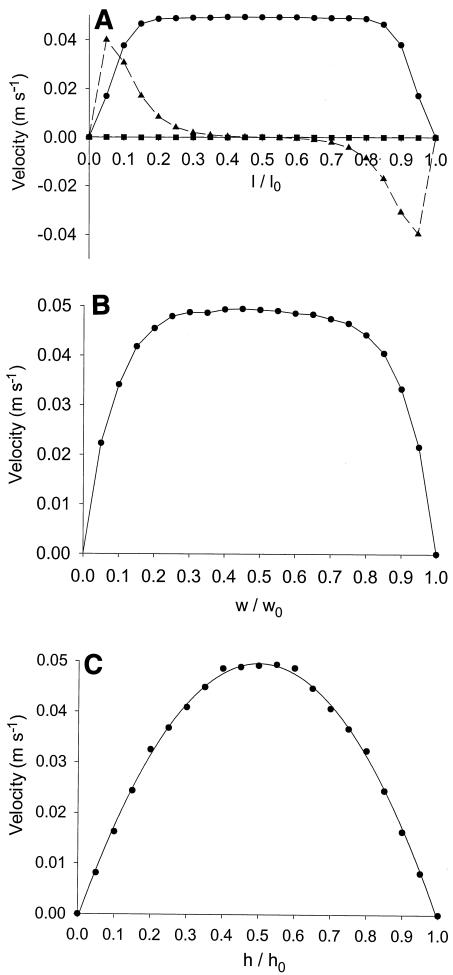
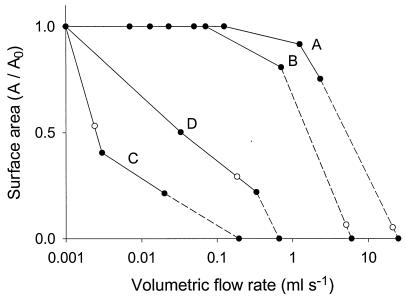
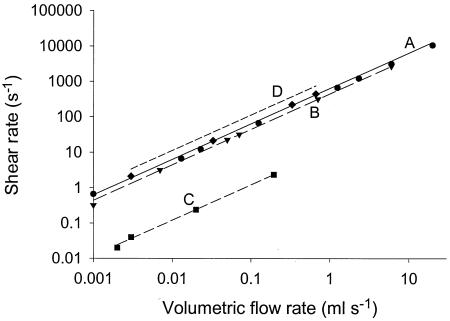
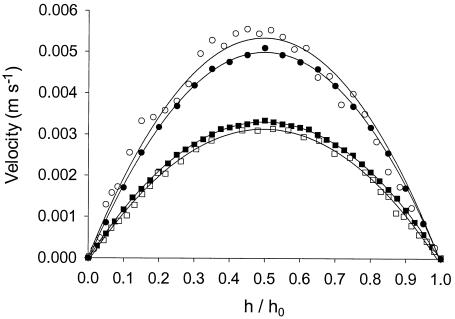
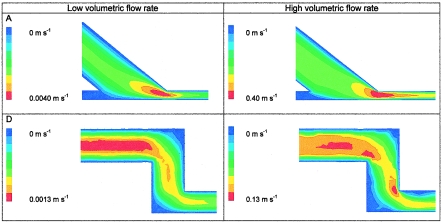
Flow chambers are commonly used to study microbial adhesion to surfaces under environmentally relevant hydrodynamic conditions. The parallel plate flow chamber (PPFC) is the most common design, and mass transport occurs through slow convective diffusion. In this study, we analyzed four different PPFCs to determine whether the expected hydrodynamic conditions, which control both mass transport and detachment forces, are actually achieved. Furthermore, the different PPFCs were critically evaluated based on the size of the area where the velocity profile was established and constant with a range of flow rates, indicating that valid observations could be made. Velocity profiles in the different chambers were calculated by using a numerical simulation model based on the finite element method and were found to coincide with the profiles measured by particle image velocimetry. Environmentally relevant shear rates between 0 and 10,000 s(-1) could be measured over a sizeable proportion of the substratum surface for only two of the four PPFCs. Two models appeared to be flawed in the design of their inlets and outlets and allowed development of a stable velocity profile only for shear rates up to 0.5 and 500 s(-1). For these PPFCs the inlet and outlet were curved, and the modeled shear rates deviated from the calculated shear rates by up to 75%. We concluded that PPFCs used for studies of microbial adhesion to surfaces should be designed so that their inlets and outlets are in line with the flow channel. Alternatively, the channel length should be increased to allow a greater length for the establishment of the desired hydrodynamic conditions.
Figures
References
-
- Alexandrou, A. 2001. Combined analytic and experimental solutions, p. 266-343. In L. Curless, V. O'Brien, and D. A. George (ed.), Principles of fluid mechanics. Prentice Hall, Upper Saddle River, N.J.
-
- Banks, M. K., and J. D. Bryers. 1992. Deposition of bacterial cells onto glass and biofilm surfaces. Biofouling 6:81-86.
-
- Bos, R., H. C. van der Mei, J. Gold, and H. J. Busscher. 2000. Retention of bacteria on a substratum surface with micro-patterned hydrophobicity. FEMS Microbiol. Lett. 189:311-315. - PubMed
-
- Bourne, M. C. 2002. Food texture and viscosity: concept and measurement, p. 14-31. Academic Press, San Diego, Calif.
Publication types
MeSH terms
Substances
LinkOut - more resources
Full Text Sources
Other Literature Sources
