. 2003 Oct 15;22(20):5323-35.
doi: 10.1093/emboj/cdg542.

EZH2 is downstream of the pRB-E2F pathway, essential for proliferation and amplified in cancer

Affiliations

EZH2 is downstream of the pRB-E2F pathway, essential for proliferation and amplified in cancer

Adrian P Bracken et al. EMBO J. .

Erratum in

Abstract

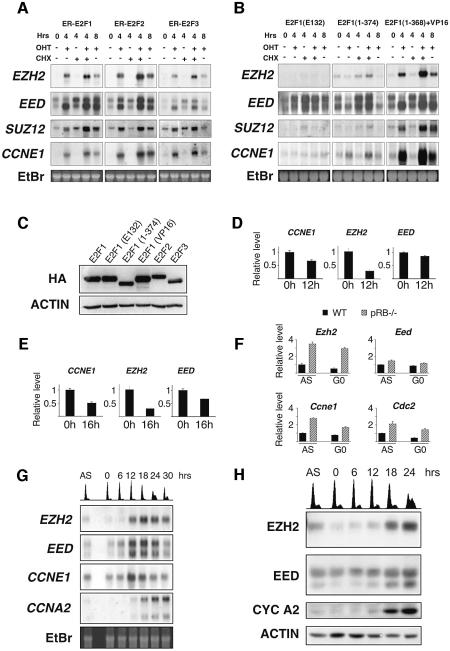
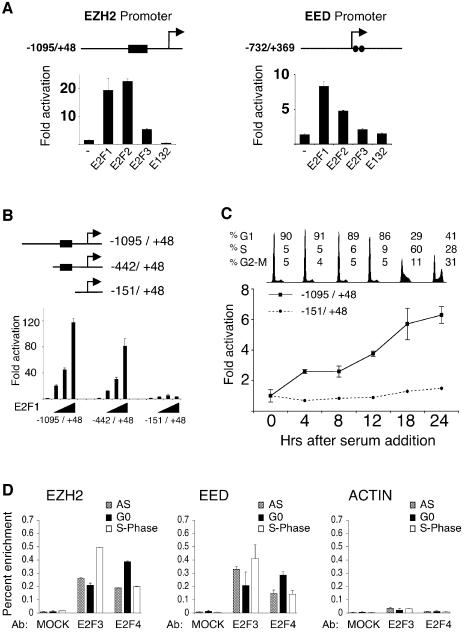
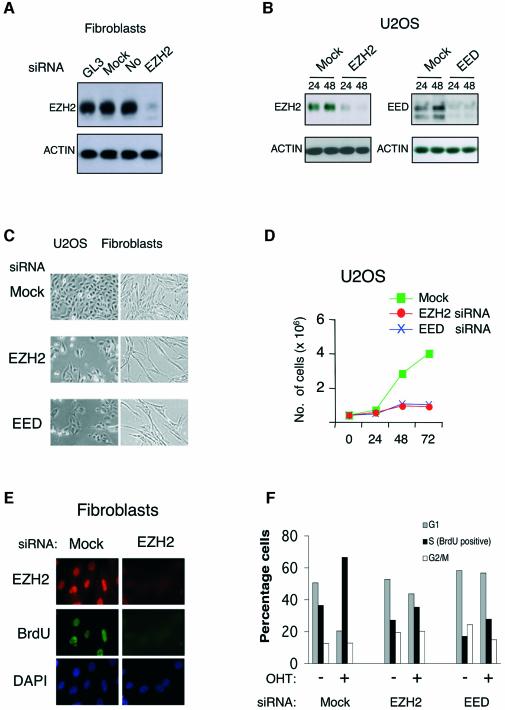
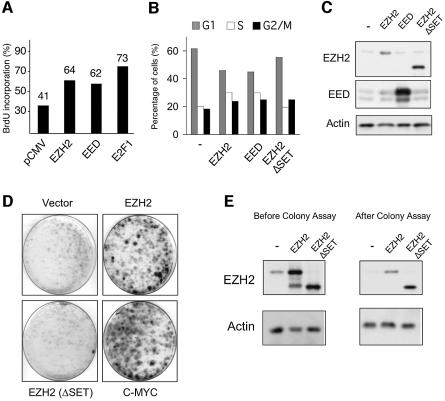
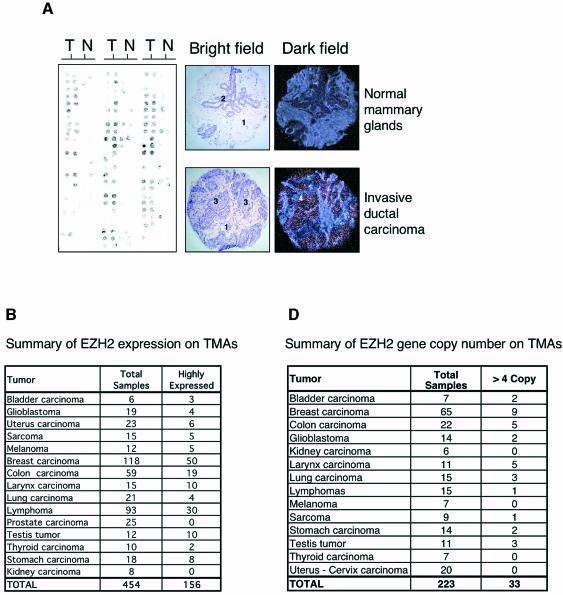
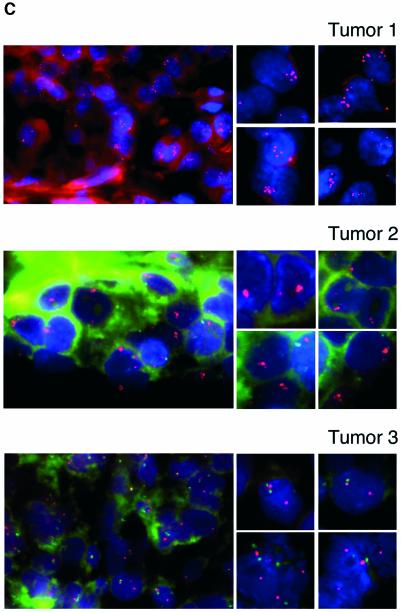
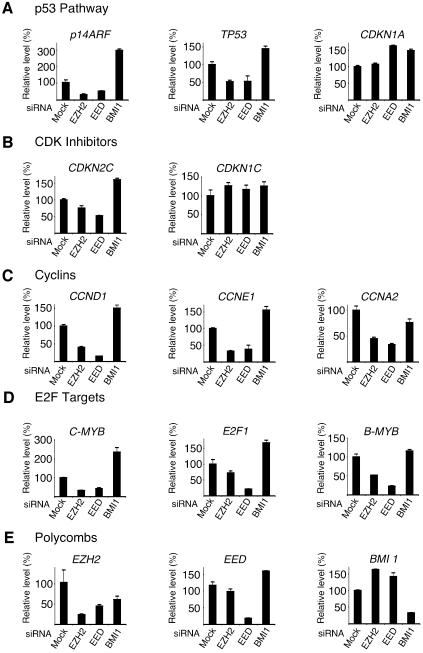
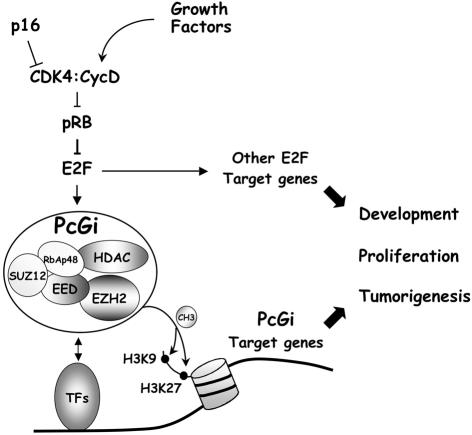
Recent experiments have demonstrated that the Polycomb group (PcG) gene EZH2 is highly expressed in metastatic prostate cancer and in lymphomas. EZH2 is a component of the PRC2 histone methyltransferase complex, which also contains EED and SUZ12 and is required for the silencing of HOX gene expression during embryonic development. Here we demonstrate that both EZH2 and EED are essential for the proliferation of both transformed and non-transformed human cells. In addition, the pRB-E2F pathway tightly regulates their expression and, consistent with this, we find that EZH2 is highly expressed in a large set of human tumors. These results raise the question whether EZH2 is a marker of proliferation or if it is actually contributing to tumor formation. Significantly, we propose that EZH2 is a bona fide oncogene, since we find that ectopic expression of EZH2 is capable of providing a proliferative advantage to primary cells and, in addition, its gene locus is specifically amplified in several primary tumors.


Figures

None
Fig. 1. The expression of EZH2 and EED is regulated by E2F and pRB. (A) Northern blot analysis of EZH2, EED, SUZ12 and CCNE1. WI38 fibroblasts expressing ER-E2F1, ER-E2F2 or ER-E2F3 were grown as indicated in the presence (+) or absence (–) of OHT and cycloheximide (CHX). mRNA was extracted at the indicated hours after addition of 4-hydroxy tamoxifen (OHT) and/or CHX. (B) Northern blot analysis as described in panel A using WI38 expressing ER-E2F1 mutants. (C) Western blot analysis of WI38 expressing ER-E2F fusion proteins. (DEZH2 and EED expression is repressed by pRB. Real-time quantitative PCR (qPCR) was used to determine relative mRNA expression levels upon induction of pRbΔcdk in U2OS cells. (EEZH2 and EED expression is repressed by p16. qPCR was used to determine the effects of p16 overexpression. (FEzh2 expression is derepressed in Rb–/– MEFs. qPCR was used to determine Ezh2, Eed, Ccne1 and Cdc2 mRNA levels in pRb-deficient and wild-type (WT) asynchronously growing (AS) and serum-starved (G0) MEFs. (G) The expression of EZH2 and EED is cell growth regulated. WI38 cells were serum starved for 72 h and re-stimulated to enter the cell cycle by the addition of serum. mRNA was prepared for northern blot analysis at the indicated time points. Propidium iodide (PI) FACS analysis is presented at the top of the panel. (H) EZH2 and EED proteins are cell growth regulated. Western blot analysis of cell lysates prepared from an IMR90 cell growth experiment similar to that described in (C). PI FACS analysis is presented at the top of the panel.
None
Fig. 2. E2F binds to the EZH2 and EED promoters to regulate their expression. (A) E2F transactivates the EZH2 and EED promoters. Schematic presentation of the genomic regions corresponding to the promoters of both EZH2 and EED. The black box in the EZH2 promoter represents a region of four putative E2F sites, while the two circles in the EED promoter each represent a putative E2F DNA binding site. The +1 represents the most 5′ nucleotide in the longest identified cDNA published in the NCBI database. The numbers on the promoter constructs are relative to +1. Luciferase reporter analysis of EZH2 and EED promoter constructs co-transfected with pCMVE2F1, pCMVE2F2, pCMVE2F3 or pCMVE2F1(E132) DNA binding mutant in 293T cells. (B) Delineation of E2F DNA binding sites in the EZH2 promoter. U2OS cells were transfected with the indicated luciferase reporter constructs and different concentrations of pCMVE2F1 and pCMVE2F1(E132). (C) E2F is required for the cell growth regulated expression of EZH2. Rat1 cells were transfected either with the indicated EZH2 promoters,serum starved for 48 h and then released into the cell cycle by the addition of serum. A plasmid expressing β-galactosidase was co-transfected to normalize luciferase activity for transfection efficiency. Fold activations refer to the empty pCMV transfection. Standard deviation of the mean is shown in each experiment. (D) E2F3 and E2F4 chromatin immunoprecipitations of TIG3 fibroblasts serum starved (G0), growing (AS) and serum released cells in S phase (S).
None
Fig. 3. EZH2 and EED are essential for proliferation of both normal and cancer cells. (A) Specific inhibition of EZH2 expression by siRNA in TIG3 fibroblasts. TIG3 cells were transfected with H2O (Mock), luciferase siRNA oligos (GL3) and oligos specific for EZH2 mRNA. Cell lysates were prepared 44 h after transfection and the EZH2 protein levels were detected by western blot. (B) Specific inhibition of EZH2 and EED expression by siRNA in U2OS cells. Cells were transfected with the indicated siRNA oligos and cell lysates were prepared for western blot analysis 24 and 48 h after transfection. (C) Inhibition of EZH2 and EED expression results in changes in cellular morphology and slower growth. Representative photos of TIG3 (fibroblast) and U2OS cells taken 48 h after siRNA transfection. (D) Inhibition of EZH2 and EED expression results in slower growth. Growth curves of EZH2, EED and mock siRNA treated U2OS are presented. The growth curves were determined in triplicate, and they are representative of three independent experiments. (E) siRNA to EZH2 results in specific decrease in EZH2 levels and inhibition of DNA synthesis. The levels EZH2 protein and the amount of BrdU incorporation were determined by immunofluorescence 44 h after transfection of BJ1 cells. (F) EZH2 and EED are required for E2F induced proliferation. ER-E2F3 expressing U2OS cells were treated with mock, EZH2 and EED siRNA for 36 h in the absence of serum. OHT was added for 14 h and the biological effect of E2F3 overexpression was determined by BrdU FACS after a 10 min pulse of BrdU.
None
Fig. 4. Ectopic expression of EZH2 results in shorter G1 and prolongs the life span of primary MEFs. (A) Ectopic expression of EZH2 and EED increases the number of cells in S-phase. Serum-starved, quiescent Rat1 cells were injected with pCMV plasmids expressing either EZH2 or EED as indicated. Cells injected with E2F1 were used as a positive control. Serum was added to the serum-starved injected cells for 14 h prior to a 45 min pulse of BrdU. Relative DNA synthesis was determined by assessing BrdU incorporation by immunofluorescence. One representative experiment of five independent experiments is shown. (B) EZH2 ectopic expression results in S phase accumulation. Cell cycle phases of HeLa cells, transfected with the indicated plasmids, were determined 48 h after transfection by PI-FACS. (C) Western blot analysis of HeLa cells show similar expression of the wild type and mutant EZH2 proteins. (D) Expression of wild type EZH2, but not a SET-domain mutant, allows primary MEFs to form colonies, when plated at low density. Primary MEFs were infected with retroviral vectors expressing the indicated proteins. The experiment shown is representative of five independent experiments using different MEF preparations. (E) Western blot analysis of MEFs infected with the indicated retroviral vectors before and after the colony assay.
None
Fig. 5. EZH2 is highly expressed and amplified in primary human tumors. (A) EZH2 is highly expressed in primary breast tumors. The expression of EZH2 mRNA levels was determined by ISH on TMA. The left panel shows a representative example of ISH for EZH2 of a breast cancer TMA. Two samples from each tumor (T) and normal (N) counterparts were taken for the TMA. The bright field panels show the morphology of the tissue sample as revealed by hematoxylin and eosin counterstaining. The dark field panels show the ISH analysis of EZH2 expression levels in a breast invasive ductal carcinoma and in a normal mammary gland. In the panels the numbers indicate: 1, stroma; 2, mammary gland epithelial cells; 3, tumor tissue; 4, EZH2 expressing cells. (B) EZH2 is highly expressed in a large number of primary human tumors. Summary table of EZH2 expression on the TMAs tested. (C) Subsets of primary tumors show an amplification of the EZH2 gene (top and middle panel). FISH analysis of tumor TMAs of EZH2 gene copy number. The two panels show two representative breast carcinoma tissues with significant amplifications of EZH2. The EZH2 specific probe was labeled with Cy5 and a centromeric probe for chromosome 7 with FITC. Due to the fast fading of the FITC probe and the relative long microscopic analysis of each TMA we were able to count, but not to take pictures of the specific staining of the centromere for several of the analyzed samples. (C, lower panel) Example of a breast tumor tissue containing a normal copy number of EZH2. FISH analysis of an unrelated gene (HECTH9) on the same TMAs revealed no amplification in all the samples tested (data not shown). (D) Summary table of EZH2 copy number of the tested TMAs.
None
Fig. 6. EZH2 and EED are required for the active transcription of several genes. Expression level analysis by qPCR of TIG3 cells tranfected for 44 h with siRNA specific for EZH2, EED and BMI1. (A) mRNA levels of members of the p53 pathway. (B) mRNA levels of CDK inhibitors. (C) mRNA levels of cyclins. (D) mRNA levels of E2F regulated genes. (E) mRNA levels of PcG genes.
None
Fig. 7. Model for the cooperative role of the pRB pathway and the PRC2 complex. See Discussion for details.

References

    1. Andersen C.L. et al. (2002) High-throughput copy number analysis of 17q23 in 3520 tissue specimens by fluorescence in situ hybridization to tissue microarrays. Am. J. Pathol., 161, 73–79. - PMC - PubMed
    1. Beier R. et al. (2000) Induction of cyclin E-cdk2 kinase activity, E2F-dependent transcription and cell growth by Myc are genetically separable events. EMBO J., 19, 5813–5823. - PMC - PubMed
    1. Brock H.W. and van Lohuizen,M. (2001) The Polycomb group—no longer an exclusive club? Curr. Opin. Genet. Dev., 11, 175–181. - PubMed
    1. Cao R., Wang,L., Wang,H., Xia,L., Erjument-Bromage,H., Tempst,P., Jones,R.S. and Zhang,Y. (2002) Role of Histone H3 Lysine 27 methylation in Polycomb-Group silencing. Science, 298, 1039–1043. - PubMed
    1. Cardoso C., Mignon,C., Hetet,G., Grandchamps,B., Fontes M. and Colleaux,I. (2000) The human EZH2 gene: genomic organisation and revised mapping in 7q35 within a critical region of malignant disorders. Eur. J. Hum. Genet., 8, 174–180. - PubMed

Publication types

MeSH terms