. 2003 Oct 15;22(20):5422-34.
doi: 10.1093/emboj/cdg519.

Loss of K-Cl co-transporter KCC3 causes deafness, neurodegeneration and reduced seizure threshold

Affiliations

Loss of K-Cl co-transporter KCC3 causes deafness, neurodegeneration and reduced seizure threshold

Thomas Boettger et al. EMBO J. .

Abstract

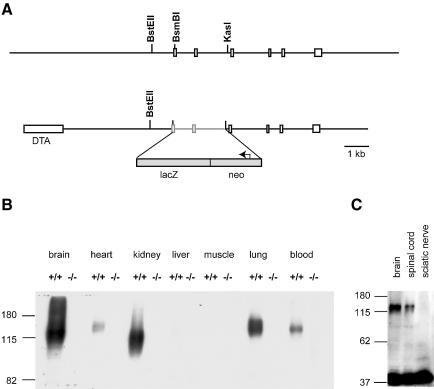
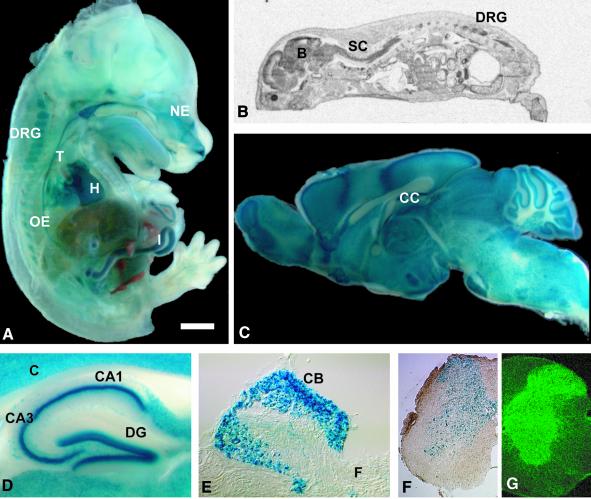
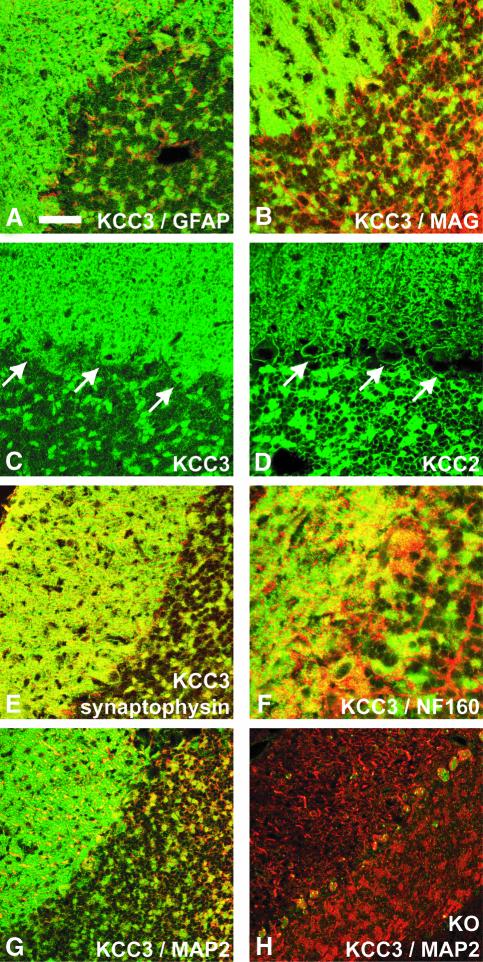
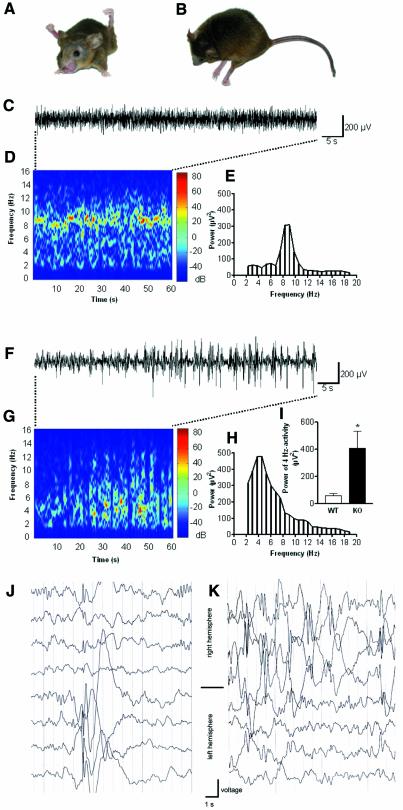
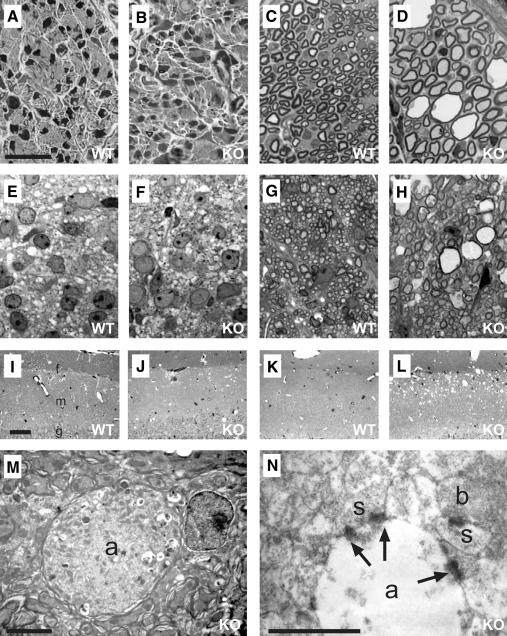
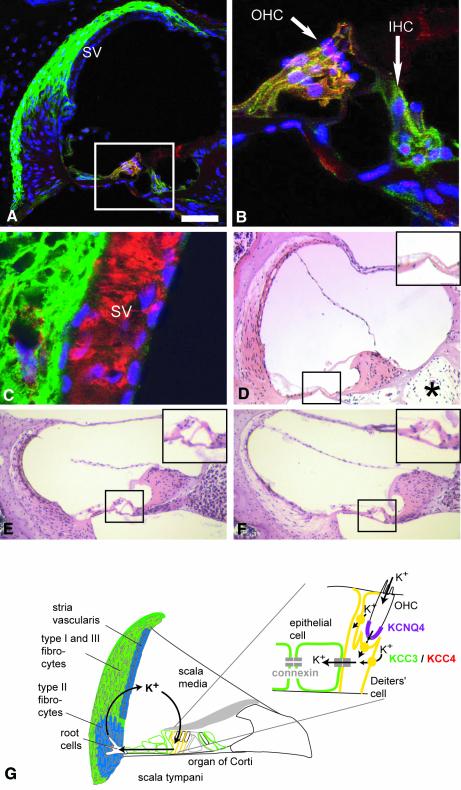
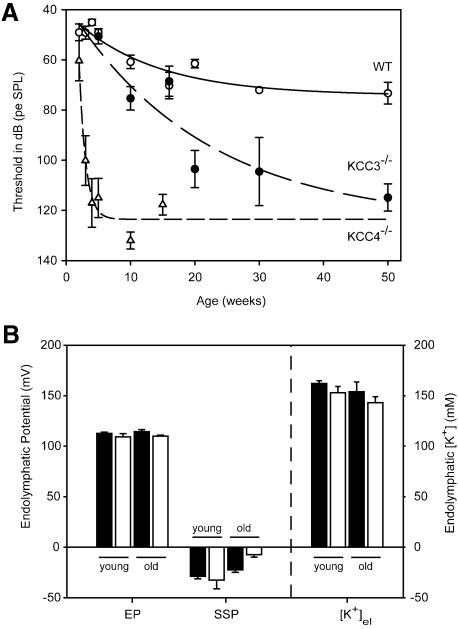
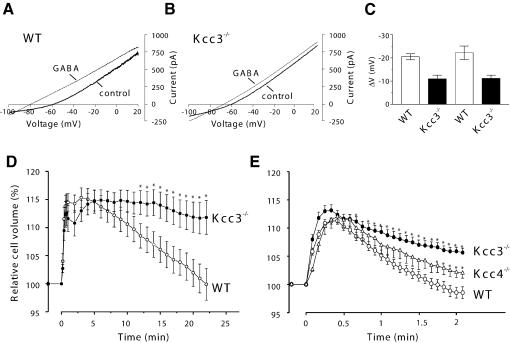
K-Cl co-transporters are encoded by four homologous genes and may have roles in transepithelial transport and in the regulation of cell volume and cytoplasmic chloride. KCC3, an isoform mutated in the human Anderman syndrome, is expressed in brain, epithelia and other tissues. To investigate the physiological functions of KCC3, we disrupted its gene in mice. This severely impaired cell volume regulation as assessed in renal tubules and neurons, and moderately raised intraneuronal Cl(-) concentration. Kcc3(-/-) mice showed severe motor abnormalities correlating with a progressive neurodegeneration in the peripheral and CNS. Although no spontaneous seizures were observed, Kcc3(-/-) mice displayed reduced seizure threshold and spike-wave complexes on electrocorticograms. These resembled EEG abnormalities in patients with Anderman syndrome. Kcc3(-/-) mice also displayed arterial hypertension and a slowly progressive deafness. KCC3 was expressed in many, but not all cells of the inner ear K(+) recycling pathway. These cells slowly degenerated, as did sensory hair cells. The present mouse model has revealed important cellular and systemic functions of KCC3 and is highly relevant for Anderman syndrome.


Figures

None
Fig. 1.Generation of Kcc3–/– mice. (A) Partial representation of the genomic sequence of KCC3 (top) and construct used for the KO (bottom). A genomic stretch containing two coding exons was replaced by β–galactosidase (LacZ) and neomycin resistance cassettes. This deleted all KCC3 sequence after and including the first transmembrane domain and resulted in a KCC3–β-galactosidase fusion protein. The box at left represents a diphtheria toxin A (DTA) cassette to select for homologous recombination. (B) Western blot analysis of protein extracts from the indicated tissues from WT (+/+) and KO (–/–) mice. The difference in protein sizes may be due to alternative splicing. (C) Western blot analysis of protein extracts from brain, spinal cord and sciatic nerve. Actin (at bottom) served as loading control.
None
Fig. 2.Expression of KCC3. (A) lacZ staining of a Kcc3+/– embryo at day 14 (E14). (BIn situ hybridization of a P0 mouse. LacZ staining of a sagittal brain section (C), hippocampus (D), a dorsal root ganglion (E) and spinal cord (F) from a Kcc3+/– mouse. (G) Immunofluorescence of spinal cord (B, brain; C, cortex, CA1 and CA3, cornu ammonis region 1 and 3; CB, neuronal cell bodies; CC, corpus callosum; DRG, dorsal root ganglion; DG, dentate gyrus; F, fibres; NE, nasal epithelium; T, trachea; H, heart; I, intestine; OE, oesophagus; SC, spinal cord). The scale bar corresponds to 126 mm in (A), 33 mm in (B), 1.5 mm in (C), 0.44 mm in (D), 0.15 mm in (E), 0.39 mm in (F) and 0.26 mm in (G).
None
Fig. 3.Subcellular distribution of KCC3 in the cerebellum. There was no significant overlap of KCC3 staining (green) with the glial marker proteins GFAP (A) or MAG (B) (red). (C) KCC3 was present in the plasma membrane and cell interior of cerebellar Purkinje cells (arrows). (D) KCC2 was almost exclusively in the plasma membrane of Purkinje cells (arrows). (E) KCC3 staining (green) largely co-localized with synaptophysin (red), a marker for synapses. (F) Staining for KCC3 (green) and neurofilament (red), a marker for axons, overlapped rarely. This was also the case when KCC3 (green) is compared with MAP2 (red), a marker for dendrites (G). (H) Staining for KCC3 of a KO mouse. The scale bar corresponds to 28 µm in (A)–(E), 18 µm in (F), and 39 µm in (G) and (H).
None
Fig. 4.Neuronal phenotype of Kcc3–/– mice. (A) Abnormal posture of a 15-month-old KO mouse reminiscent of spasticity. (B) Another KO mouse lay flat on the ground. (C–I) ECoG analysis. Comparison of WT (C–E and I) and KO animals (F–I). (C) Original trace of field potential recording in a freely moving WT control. (D) Colour-coded power spectrum of the trace illustrated in (C). Note activity at 7–10 Hz. (E) Conventional fast Fourier transformation (FFT) of the trace in (C) indicates a predominant frequency at 7–10 Hz. (F) Original trace in KO animal with spontaneous high-voltage spike-wave-like complexes. (G) Colour-coded power spectrum of the trace in (F). (H) Conventional FFT of this trace indicates a wideband frequency range with a peak at 4 Hz. (I) Comparison of the power of the 4 Hz activity. KO mice (n = 6) showed a significantly higher power of the 4 Hz activity (P <0.005) compared with WT (n = 6). (J and K) Electroencephalograms (EEGs) from two patients carrying a homozygous missense mutation in the KCC3 gene.
None
Fig. 5.Neurodegeneration in Kcc3–/– mice. Semi-thin sections from sciatic nerve (AD) and white matter of the spinal cord (EH) at P1 (A, B, E and F) from WT (A, E, C and G) and KO (B, D, F and H) animals. (IL) Semi-thin sections mainly of the molecular layer [m in (I); g, border of granular layer; f, hippocampal fissure] of hippocampal dentate gyrus from P13 (I and J) and 3 month (K and L) old animals. (M and N) Electron micrographs of swollen axons (a) in 3-month-old hippocampi. M, a myelinated axon filled with degradation product; N, a degenerated unmyelinated axon with synapses (arrows) terminating on morphologically intact spines (s). Intact axonal boutons (b) were present in the vicinity. The scale bar corresponds to: 20 µm in (A)–(H) and (M), 50 µm in (I)–(L) and 5 µm in (N).
None
Fig. 6.Cochlear expression of KCC3 and morphological changes in the KO. (A) Staining for KCC3 (green) and KCC4 (red) in a cross-section of the scala media. KCC3 is found in type I and type III fibrocytes below the stria vascularis (SV), but not in type II fibrocytes. In the organ of Corti [enclosed by the frame and shown in higher magnification in (B)], KCC3 is in supporting cells of OHCs and IHCs and in additional epithelial cells. Supporting cells expressed both KCC3 and KCC4, yielding yellow (A, B and G). Nuclei were counterstained in blue. (C) Higher magnification of the stria vascularis and adjacent type I fibrocytes. KCC3 is shown in green and Kir4.1, a K+ channel of intermediate cells, in red. (D) Haematoxylin–eosin-stained cross-section of a basal cochlear turn of a 15-month-old KO mouse. Note degeneration of type I and III and preservation of type II fibrocytes, loss of the organ of Corti (black frame; shown in higher magnification in upper right) and cell loss in the cochlear ganglion (*). Cross-sections through a basal turn of the cochlea of a 4-month-old WT (E) and KO mouse (F). (G) Inner ear K+ recycling pathway. KCC3 is shown in green, co-expression with KCC4 in yellow, NKCC1 in blue and KCNQ4 in magenta. The scale bar corresponds to 50 µm in (A), 14 µm in (B), 9.4 µm in (C) and 100 µm in (D)–(F).
None
Fig. 7.Functional tests of the inner ear. (A) Thresholds of auditory brainstem responses to clicks in WT (open circles) and Kcc3–/– (filled circles) animals as a function of age. For comparison, published data from Kcc4–/– mice (Boettger et al., 2002) were included (open triangles). Bars indicate the standard error of seven or more animals. (B) EP, post mortem endocochlear SSP and endolymph K+ concentration ([K+]el) in young (<75 days) and old (>110 days) WT (filled bar) or Kcc3–/– (KO; open bar) mice. Mean ages for young animals were 51 days (WT) and 39 days (KO), and for old mice 181 days (WT) and 204 days (KO). Only the SSP in old KO mice was significantly different from WT (P <0.01). EP was measured in 13 WT and eight KO animals, [K+]el in nine WT and seven KO animals.
None
Fig. 8.Cell physiological effects of deleting KCC3. (AC) Changes in neuronal [Cl]i studied by perforated patch-clamp measurements of P12–P14 Purkinje cells. Representative I–V relationships of WT (A) and Kcc3–/– (B) Purkinje cells measured in voltage-clamp before (thick line) and after (thin line) applying 100 µM GABA. From –60 mV, cells were stepped for 80 ms to +20 mV and the voltage was reduced to –100 mV with a voltage ramp (150 mV/s). (C) Mean shift in voltage (± SEM) upon GABA application in either voltage clamp (first two bars) or current clamp mode of WT or KO cells. From the left, n = 4, 4, 8 and 6. The differences in GABA-induced hyperpolarization were significant at the P <0.05 level in either recording mode. The resting potentials were not significantly different between WT (–59.4 ± 1.7 mV) and KO (–60.0 ± 0.9 mV). (D and E) Cell volume regulation of cultured hippocampal pyramidal cells (D) and renal proximal tubular cells (E) of WT (open circles) and Kcc3–/– (filled circles) mice. (E) also includes data from Kcc4–/– (open triangles) mice. Cells were exposed to hypoosmotic medium (230 mosmol/l) at t = 0. Cell volume is expressed as a percent of the volume at t = 0. Error bars indicate SEM and asterisks significant differences from the WT (P <0.05). The numbers of measurements were: (D) 13 KO and 12 WT cells from four animals; (E) Kcc3–/–, 22 tubules from six mice; Kcc4–/–, 10 tubules from five mice; WT, 30 tubules from 11 mice.

References

    1. Ando M. and Takeuchi,S. (1999) Immunological identification of an inward rectifier K+ channel (Kir4.1) in the intermediate cell (melanocyte) of the cochlear stria vascularis of gerbils and rats. Cell Tissue Res., 298, 179–183. - PubMed
    1. Boettger T., Hübner,C.A., Maier,H., Rust,M.B., Beck,F.X. and Jentsch,T.J. (2002) Deafness and renal tubular acidosis in mice lacking the K-Cl co-transporter Kcc4. Nature, 416, 874–878. - PubMed
    1. Bösl M.R., Stein,V., Hübner,C., Zdebik,A.A., Jordt,S.E., Mukhopadhyay,A.K., Davidoff,M.S., Holstein,A.F. and Jentsch,T.J. (2001) Male germ cells and photoreceptors, both dependent on close cell-cell interactions, degenerate upon ClC-2 Cl– channel disruption. EMBO J., 20, 1289–1299. - PMC - PubMed
    1. Crunelli V. and Leresche,N. (2002) Childhood absence epilepsy: genes, channels, neurons and networks. Nat. Rev. Neurosci., 3, 371–382. - PubMed
    1. Dupré N., Howard,H.C., Mathieu,J., Karpati,G., Vanasse,M., Bouchard,J.P., Carpenter,S. and Rouleau,G.A. (2003) Hereditary motor and sensory neuropathy with agenesis of the corpus callosum. Ann. Neurol., 54, 9–18. - PubMed

Publication types

MeSH terms