Comparative Study
. 2003 Oct 8;23(27):9032-45.
doi: 10.1523/JNEUROSCI.23-27-09032.2003.

Quantifying generalization from trial-by-trial behavior of adaptive systems that learn with basis functions: theory and experiments in human motor control

Affiliations
Comparative Study

Quantifying generalization from trial-by-trial behavior of adaptive systems that learn with basis functions: theory and experiments in human motor control

Opher Donchin et al. J Neurosci. .

Abstract

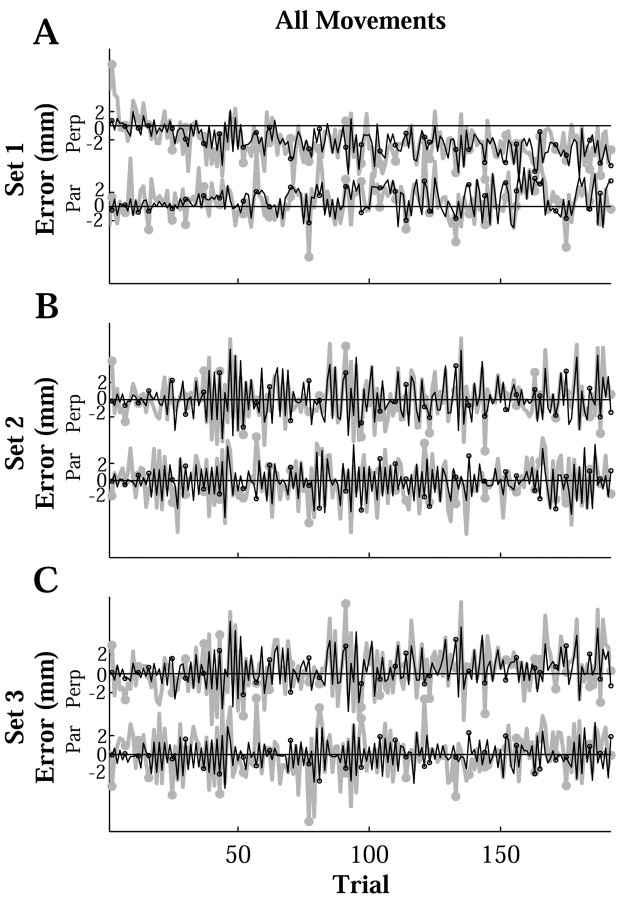
During reaching movements, the brain's internal models map desired limb motion into predicted forces. When the forces in the task change, these models adapt. Adaptation is guided by generalization: errors in one movement influence prediction in other types of movement. If the mapping is accomplished with population coding, combining basis elements that encode different regions of movement space, then generalization can reveal the encoding of the basis elements. We present a theory that relates encoding to generalization using trial-by-trial changes in behavior during adaptation. We consider adaptation during reaching movements in various velocity-dependent force fields and quantify how errors generalize across direction. We find that the measurement of error is critical to the theory. A typical assumption in motor control is that error is the difference between a current trajectory and a desired trajectory (DJ) that does not change during adaptation. Under this assumption, in all force fields that we examined, including one in which force randomly changes from trial to trial, we found a bimodal generalization pattern, perhaps reflecting basis elements that encode direction bimodally. If the DJ was allowed to vary, bimodality was reduced or eliminated, but the generalization function accounted for nearly twice as much variance. We suggest, therefore, that basis elements representing the internal model of dynamics are sensitive to limb velocity with bimodal tuning; however, it is also possible that during adaptation the error metric itself adapts, which affects the implied shape of the basis elements.


Figures

Figure 1.
Figure 1.
A, Experimental setup and the coordinate system for simulations of human arm and robot arm dynamics. B-F, Force fields that we examined in this report. In each case, F = Vẋ. Units of V are in kilograms per second. B, Standard curl field, formula image; C, opposite curl field, formula image; D, curl-assist field, formula image; D, saddle field, formula image
Figure 2.
Figure 2.
A, B, Parameters of the fit using Equation 3 on data from simulations with different σ. A, A graphical representation of the matrix D. D is a compliance matrix that transforms force on the hand into displacement. To represent this, we multiply D by a force vector of length 1 N as the vector rotates about a circle. The result is hand displacement. The coordinates of the force vector are Cartesian, centered at the position of the hand (data not shown). The intersecting lines show the effect of D on the coordinate axes of force. B, The generalization function, B, characterizes the effects of error in one direction on all other directions of movement. The x-axis shows the difference (in degrees) between the direction in which the error was experienced and the other directions of movement. The y-axis is unitless gain. It describes what portion of the error vector (in terms of a ratio) was distributed to the state in which the movement occurred (0°) and neighboring states. Note how wider Gaussian basis elements (larger σ) produce a wider generalization function. C, A comparison of the generalization function found by two different methods for basis elements of different widths. Solid lines come from fitting the dynamic model (Eq. 3); dashed lines were calculated using the numerical derivation (Eq. 4). The results from the numerical derivation have been scaled down by a factor of 1.3. The factor was apparently introduced by the approximations made in the derivation.
Figure 3.
Figure 3.
Averaged performance of subjects (n = 75) in a clockwise curl field with occasional catch trials. X and Y components of the data are shown in gray; fit for the model (Eq. 3) is in black. Circles indicate catch trials. A-H, Movements in each of the eight directions during a 192-movement set. I, All directions of the first 75 movements of the set. Standard errors (data not shown) for the measured data are on the order of 1 mm. The r2 for the fit of the model over the entire 192-movement set is 0.77.
Figure 4.
Figure 4.
Averaged performance of subjects in a clockwise curl field. Errors parallel (Par) to the movement direction and perpendicular (Perp) direction are shown. Gray is subject data, and black is model fit. Circles indicate catch trials. A, B, Errors in the first fielded set (n = 75 subjects). C, D, Errors in the second fielded set (n = 75 subjects). E, F, Errors in the third fielded set (n = 44 subjects). The sequence of targets and the catch trials are the same in each set. r2 values for all movements within a set are 0.77, 0.80, and 0.77, respectively, for sets 1-3. Note that a “learning curve” can be seen clearly only in the first half of the first set.
Figure 5.
Figure 5.
Parameters of the models that produced the fit to subject data shown in Figure 4. A, The D matrixes are illustrated following the format of Figure 2 A as the effect of the matrixes on the unit circle. B, The generalization functions for the three successive sets performed by the subject. Error bars are bootstrapped standard errors.
Figure 6.
Figure 6.
The quality of the fit caused by the generalization function (B) is demonstrated by plotting y - DF - z(0) (gray) and ŷ - DF - z(0) (black), thereby eliminating from the fit the contribution of both the compliance matrix D and any average difference between the directions. As can be seen, many of the details of the remaining variation are still being captured. Format is the same as Figure 4. Par, Parallel; Perp, perpendicular.
Figure 7.
Figure 7.
A-D, Generalization functions were estimated from data that were generated using simulations of an adaptive controller that uses bimodal primitives in its internal model. Generalization functions are shown for different values of the two parameters: K, the ratio of the peak heights, and σ, the width in meters per second. Superimposed on them (dashed black line) is the generalization function found in the subject data, averaged over the three generalization functions in Figure 5B. E, The shape of the primitives implied by the generalization functions found in the subject data (Fig. 5). This is the activation function of a single primitive the center of which is at [0.21, 0.21] (approximately peak velocity for a 10 cm movement to 45°). For this primitive, σ = 0.15 and K = 2. The actual prediction of force is computed by an average of the force associated with each primitive, weighted by the activation. The axes of this graph are X velocity and Y velocity, and the limits are from -0.5 to 0.5 m/sec for both X and Y.
Figure 8.
Figure 8.
A model-free assessment of the generalization function in a clockwise curl field. We found all occurrences where in the intervening trials between two field trials in the same direction there was a catch trial (field-catch-field) in some other direction. This plot shows the vectorial difference between the position at maximum velocity of the first and last field trials. The top vector shows cases in which the middle trial is in the same direction as these trials. The next vector clockwise shows cases in which the middle trial was 45° clockwise from the direction of these trials.
Figure 9.
Figure 9.
Errors and the fit of the model (Eq. 3) to a set of 192 movements in variations of the clockwise curl field task. Each row of plots represents a different variation. A, B, Movements in a clockwise curl field using target sets in which the out-and-back structure has been removed; r2 = 0.72 (n = 9). C, D, Movements in a curl-assist field; r2 = 0.74 (n = 8). E, F, Movements in a saddle field; r2 = 0.68 (n = 9). G, H, Movements in a random field; r2 = 0.82 (n = 12). Format for plots is as in Figure 4. Par, Parallel; Perp, perpendicular.
Figure 10.
Figure 10.
The compliance and generalization parameters for the fits of Equation 3 to data collected in the variations on the original task. A, B, Clockwise curl field with uncorrelated target set structure. C, D, Curl-assist field. E, F, Saddle field. G, H, Random field. Left column represents the compliance matrix D; right column is the generalization function B. Format is as in Figure 2.
Figure 11.
Figure 11.
A comparison of the desired trajectory as estimated by the movements at the end of null field training (Null; gray) and by the movements at the end of training in a field (Training; black). The first column shows the movement trajectories (with a dot at the position of maximum velocity). The second column shows the speed profiles.
Figure 12.
Figure 12.
Allowing change in the desired trajectory improved the ability of the dynamic model to fit the data. Each plot shows the generalization function using a changed desired trajectory for each of the variations of the paradigm. The rB2 for each of the fits is 0.48, 0.38, and 0.35 (A) for the three sets 0.35 (B), 0.34 (C), 0.35 (D), and 0.18 (E).

Similar articles

Cited by

References

    1. Ahissar M, Hochstein S ( 1997) Task difficulty and the specificity of perceptual learning. Nature 387: 401-406. - PubMed
    1. Bosco G, Rankin A, Poppele R ( 1996) Representation of passive hindlimb postures in cat spinocerebellar activity. J Neurophysiol 76: 715-726. - PubMed
    1. Brashers-Krug T, Shadmehr R, Bizzi E ( 1996) Consolidation in human motor memory. Nature 382: 252-255. - PubMed
    1. Coltz JD, Johnson MT, Ebner TJ ( 1999) Cerebellar Purkinje cell simple spike discharge encodes movement velocity in primates during visuomotor arm tracking. J Neurosci 19: 1782-1803. - PMC - PubMed
    1. Conditt MA, Mussa-Ivaldi FA ( 1999) Central representation of time during motor learning. Proc Natl Acad Sci USA 96: 11625-11630. - PMC - PubMed

Publication types

LinkOut - more resources