. 2003 Oct 8;23(27):9046-58.
doi: 10.1523/JNEUROSCI.23-27-09046.2003.

Mechanisms of mitochondria-neurofilament interactions

Affiliations

Mechanisms of mitochondria-neurofilament interactions

O I Wagner et al. J Neurosci. .

Abstract

Mitochondria are localized to regions of the cell where ATP consumption is high and are dispersed according to changes in local energy needs. In addition to motion directed by molecular motors, mitochondrial distribution in neuronal cells appears to depend on the docking of mitochondria to microtubules and neurofilaments. We examined interactions between mitochondria and neurofilaments using fluorescence microscopy, dynamic light scattering, atomic force microscopy, and sedimentation assays. Mitochondria-neurofilament interactions depend on mitochondrial membrane potential, as revealed by staining with a membrane potential sensitive dye (JC-1) in the presence of substrates/ADP or uncouplers (valinomycin/carbonyl cyanide p-(trifluoromethoxy)phenylhydrazone) and are affected by the phosphorylation status of neurofilaments and neurofilament sidearms. Antibodies against the neurofilament heavy subunit disrupt binding between mitochondria and neurofilaments, and isolated neurofilament sidearms alone interact with mitochondria, suggesting that they mediate the interactions between the two structures. These data suggest that specific and regulated mitochondrial-neurofilament interactions occur in situ and may contribute to the dynamic distribution of these organelles within the cytoplasm of neurons.


Figures

Figure 5.
Figure 5.
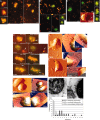
Phosphorylated NF-sidearms bind to energized mitochondria. A, B, Binding of rhodamine-labeled ctSA-Hs at low (0.09 μg/ml) (A) and high (0.36 μg/ml) (B) concentrations to energized mitochondria in the presence of ADP and substrates. The ctSA-Hs appear as small (pseudocolored) red dots on the mitochondrial surface. C, D, Nonenergized (C) and uncoupled (D) mitochondria lack binding ctSA-Hs (0.36 μg/ml). E, Binding of increasing concentrations (0-10 μg/ml) of ctSA-Hs incubated with 2 mg/ml mitochondria followed by separation of mitochondria by sedimentation (see Materials and Methods). Western blotting using the monoclonal anti-NF antibody (SMI 31) shows that mitochondria-bound ctSA-Hs were obviously reduced after discharging the mitochondria membranes with FCCP. F, Quantification of rho-ctSA-H (0.1 μg/ml) binding to mitochondria reveals a similar binding pattern as observed for the whole filament (compare Fig. 3I). Scale bar of representative mitochondria for each condition = 1 μm.
Figure 3.
Figure 3.
Interactions between ctNFs and mitochondria. A, Energized mitochondria (0.15 mg/ml) stained with reduced JC-1 concentration (0.5 μm) reveal a yellowish color (compare with Fig. 1 D, top fluorescence image), allowing for visualization of both high membrane potential and bound rhodamine-labeled NFs (15 nm), shown in pseudocolored red. The focus was both on the top of the mitochondria (small images, first panel) and near the glass surface (larger images, second and third panels). Nonenergized (B) and uncoupled (C) mitochondria do not bind to rho-NFs. Irregular surfaces of mitochondria were observed frequently in both AFM and fluorescence microscopy (AFM image in C). D, Two examples of online additions of FCCP (1 μm) and valinomycin (90 nm) to mitochondria, which induced the release of bound NFs (white arrows) and a simultaneous discharge of mitochondrial membrane within seconds. E, F, AFM amplitude (E1 and F1) images (followed by 3D converted height images of different viewing angles, E2,3 and F2,3) of unstained (non-JC-1 treated) energized mitochondria (0.15 mg/ml) bound to unlabeled NFs (15 nm). The arrows point to NFs bound to the mitochondrial surface. G, Uncoupled mitochondria visualized by AFM in the presence of NFs reveal a smooth surface depleted of bound NFs (G1 = amplitude image; G2-4 = 3D converted height image). H, TEM image of a mixture of isolated (energized) mitochondria and NFs showing that NFs bind the membrane en passant, through lateral interactions likely mediated by NF sidearms. Scale bar, 100 nm. I, Quantification of ctNFs attached to energized, nonenergized, and uncoupled mitochondria (15-50 mitochondria from 2-6 independently repeated experiments), as revealed by fluorescence microscopy, counted by an unbiased observer. Scale bar for the fluorescence images of representative mitochondria for each condition = 1 μm.
Figure 1.
Figure 1.
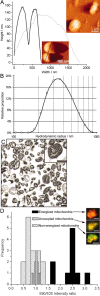
Visualizing mitochondria with the AFM, fluorescence microscope, TEM, and DLS. A, AFM imaging (line scan revealed from the height image) bears mostly spherical-shaped mitochondria with diameters between 200 nm (solid line, bottom image) and 2 μm (dotted line, top image), in agreement with DLS measurements (B). C, TEM images (scale bar, 500 nm) of ultrathin sections of isolated mitochondria showing intact (condensed) matrices, of a size distribution comparable with DLS measurements (B). D, Mitochondria (0.15 mg/ml) stained with 1.8 μm JC-1. Energized mitochondria were treated with 5 mm malate, 5 mm glutamate, and 0.1 mm ADP. To uncouple mitochondria 1 μm FCCP and 90 nm valinomycin were added to energized mitochondria. The graph shows reproducible distributions of the ratio values of red-to-green fluorescence of JC-1-stained mitochondria. For the fluorescence images of representative mitochondria for each condition, scale bar = 1 μm. Because some mitochondria are smaller than the wavelength of the emitted light (compare A and B, C), they may appear larger in fluorescence images than they actually are.
Figure 2.
Figure 2.
Visualization of NFs. A, SDS-PAGE and Coomassie brilliant blue staining of ctNFs (first lane) and dpNFs (second lane) (20 μg loaded). The three NF subunits are named according to their migration speed in the gel and apparent MW (NF-H = 200 kDa, NF-M = 150 kDa, NF-L = 68 kDa). After extensive dephosphorylation (see Materials and Methods), the migration speed of the NF-H and the NF-M subunits increases as a result of phosphorylation-dependent conformational changes of their C-terminal domains (apparent MW 160 and 121 kDa, respectively). B, Fluorescence image of rhodamine B-stained NF (15 nm). C, AFM imaging of unstained NF (15 nm). No morphological difference between stained (B) and unstained (C) NFs was observed. D, After incubation of an NF suspension with α-chymotrypsin followed by sedimentation of insoluble NFs (see Material and Methods), the supernatant contains mainly the C-terminal fragment of NF-H sidearms (ctSA-H, apparent MW 160 kDa) and trace amounts of NF-M (ctSA, first panel, 2 μg loaded). After extensive dephosphorylation of the solubilized SAs with agarose-bound alkaline phosphatase, the Coomassie brilliant blue staining of SAs was nearly abolished (dpSA, first panel, 2 μg loaded); however, immunoblotting of the same NF (10 μg loaded), ctSA, and dpSA fractions (2 μg loaded) with antibodies specific to the phosphorylated (SMI 31, second panel) and dephosphorylated (SMI 32, third panel) NF-H/NF-M chains revealed the distinct migration pattern of dpSA-H (third panel, third lane) compared with ctSA-H (second panel, second lane). E, SDS-PAGE and Coomassie brilliant blue staining of SAs after separation according to the method of Chin et al. (1989). Scale bar for the fluorescence image = 1 μm.
Figure 4.
Figure 4.
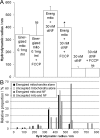
Mitochondrial hydrodynamic radii after reversible interactions with NFs in equilibrium. A, Hydrodynamic radius of energized and uncoupled mitochondria (0.1 mg/ml) with and without NFs (30 nm) revealed by DLS. Unlabeled NFs added to unstained mitochondria induced a consecutive increase of the hydrodynamic radius of energized mitochondria (third bar). The addition of FCCP (1 μm) and valinomycin (90 nm) to the same cuvette of a mitochondria-NF mixture determined the reduction of the radius close to the value of mitochondria alone (compare second and fourth bar). The contribution of the hydrodynamic radius of NFs alone is negligible (last two bars). B, Size distribution histogram representing the relative proportion (of 100% of the total population) (compare Fig. 1 B) of hydrodynamic radii for the mitochondria-NF experiments shown in A.
Figure 6.
Figure 6.
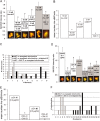
Specificity of mitochondria-NF and mitochondria-SA interactions. Specificity of mitochondria-NF/SA interactions was investigated by incubating mitochondria with unlabeled NFs before adding rho-NFs or by incubating NFs/SAs with monoclonal anti-NF antibodies before adding to mitochondria. A, Open bars indicate 590/525 nm intensity ratio of energized mitochondria incubated without or with 90, 15, or 3 nm unlabeled NFs for 20 min before the addition of 15 nm rho-ctNFs. Closed bars indicate 590/525 intensity ratio of energized mitochondria mixed with ctNFs preincubated without and with antibodies against ctNFs (SMI 31). B, Mean numbers of rho-ctNFs attached per mitochondrion incubated without or with unlabeled ctNFs. Lowest values were obtained by the addition of rho-ctNFs preincubated (20 min) with SMI 31 (1:200) to mitochondria (in the absence of unlabeled NFs). C, Distributions of filament counts as shown in B (unlabeled NFs = 90 nm). D, Intensity ratio (590/525) of energized mitochondria interacting with ctSA-Hs (0.39 μg/ml) (open bars) and ctSA-Ms (0.8 μg/ml) (closed bars) in the presence or absence of SMI 31. The binding of ctSA-Ms is statistically lower (p < 0.01) compared with that of ctSA-Hs (compare first and fourth bar). E, Mean numbers of rho-ctSA-Hs and -Ms, in the presence or absence of SMI 31, attached per mitochondrion (SMI dilutions were 1:200 for SA-Hs and 1:100 for SA-Ms). F, Distributions of rho-SA-Hs (0.1 μg/ml) counts as shown in E. Scale bar of representative mitochondria for each condition = 1 μm.
Figure 7.
Figure 7.
Effect of dephosphorylation on the binding of NFs to mitochondria. A, Binding of rhodamine-labeled dpNFs (pseudocolored red) to energized mitochondria (arrows point to single dpNFs) is lower compared with that of ctNFs (compare Fig. 3A, Table 1); however, dpNFs interact also with nonenergized (B) or uncoupled (C) mitochondria (each row of images in B and C show, from left to right, different z-sections). D, Quantification of dpNFs bound to energized (closed bars), nonenergized (dotted bars), and uncoupled (gray bars) mitochondria. In the presence of the anti-NF antibody SMI 32 (1:500), binding to energized mitochondria was significantly reduced. E, Specificity of binding of unlabeled ctNFs and dpNFs to unstained energized mitochondria (0.1 mg/ml) in equilibrium as revealed by DLS. The monoclonal antibody prevents binding of both ctNFs and dpNFs to the mitochondrion, which is reflected by a significant reduction of the hydrodynamic radius. Scale bar of representative mitochondria for each condition = 1 μm.
Figure 8.
Figure 8.
Binding of dephosphorylated sidearms to mitochondria. Quantification of rho-dpSA-H (0.1 μg/ml) binding to mitochondria (revealed from fluorescence images; data not shown) shows a similar binding pattern as found for dpNFs (compare Fig. 7D, Table 2).

References

    1. Almahbobi G, Williams LJ, Han XG, Hall PF ( 1993) Binding of lipid droplets and mitochondria to intermediate filaments in rat Leydig cells. J Reprod Fertil 98: 209-217. - PubMed
    1. Aranda-Espinoza H, Carl P, Leterrier JF, Janmey P, Discher DE ( 2002) Domain unfolding in neurofilament sidearms: effects of phosphorylation and ATP. FEBS Lett 531: 397-401. - PubMed
    1. Aw TY, Jones DP ( 1988) Microzonation of ATP and pH in the aqueous cytoplasm of mammalian cells. In: Microcompartmentation, pp 191-208. Boca Raton, FL: CRC.
    1. Baas PW, Deitch JS, Black MM, Banker GA ( 1988) Polarity orientation of microtubules in hippocampal neurons: uniformity in the axon and nonuniformity in the dendrite. Proc Natl Acad Sci USA 85: 8335-8339. - PMC - PubMed
    1. Benshalom G, Reese TS ( 1985) Ultrastructural observations on the cytoarchitecture of axons processed by rapid-freezing and freeze-substitution. J Neurocytol 14: 943-960. - PubMed

Publication types

MeSH terms

LinkOut - more resources