

Quantitative estimate of synaptic inputs to striatal neurons during up and down states in vitro
- PMID: 14534246
- PMCID: PMC6740825
- DOI: 10.1523/JNEUROSCI.23-27-09123.2003
Quantitative estimate of synaptic inputs to striatal neurons during up and down states in vitro
Abstract
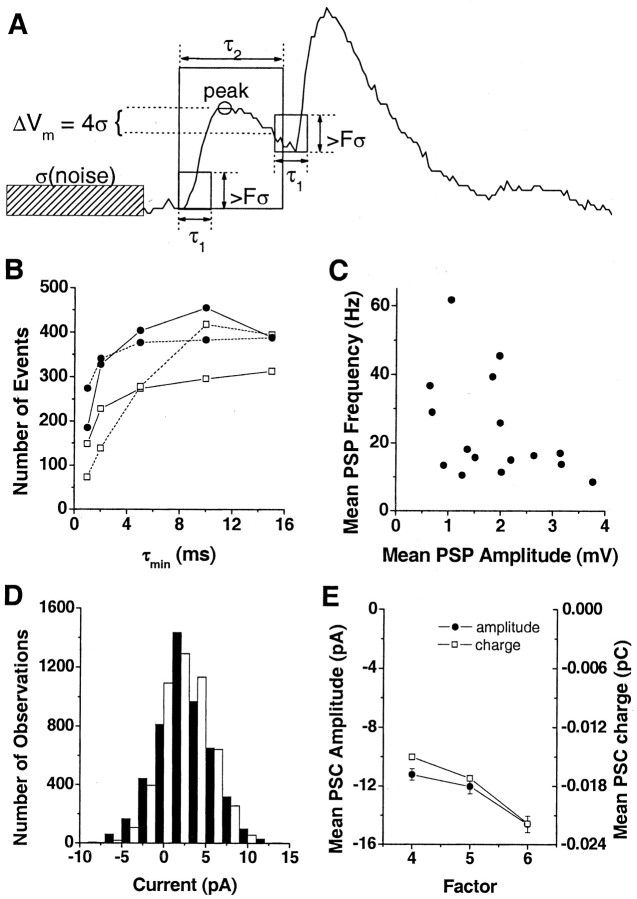
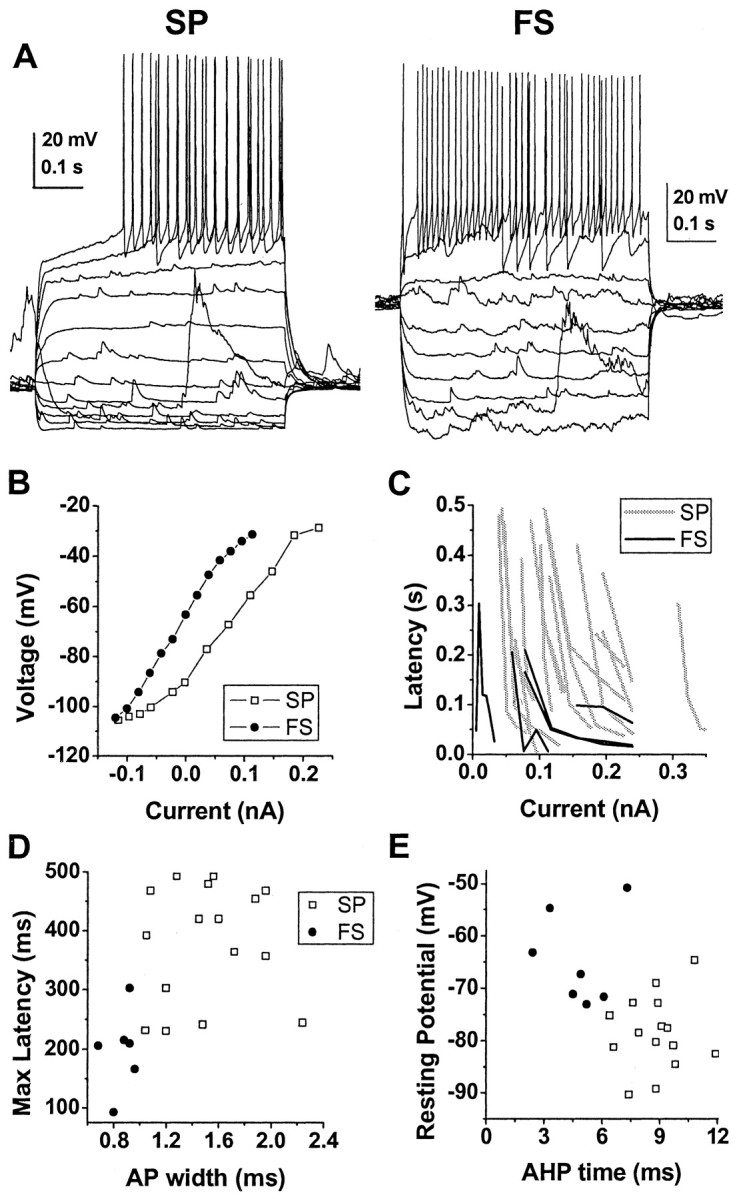
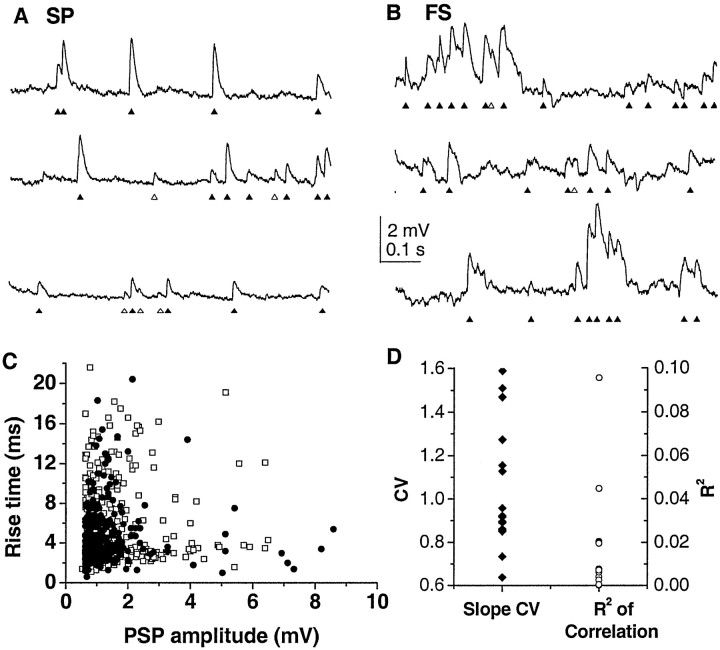
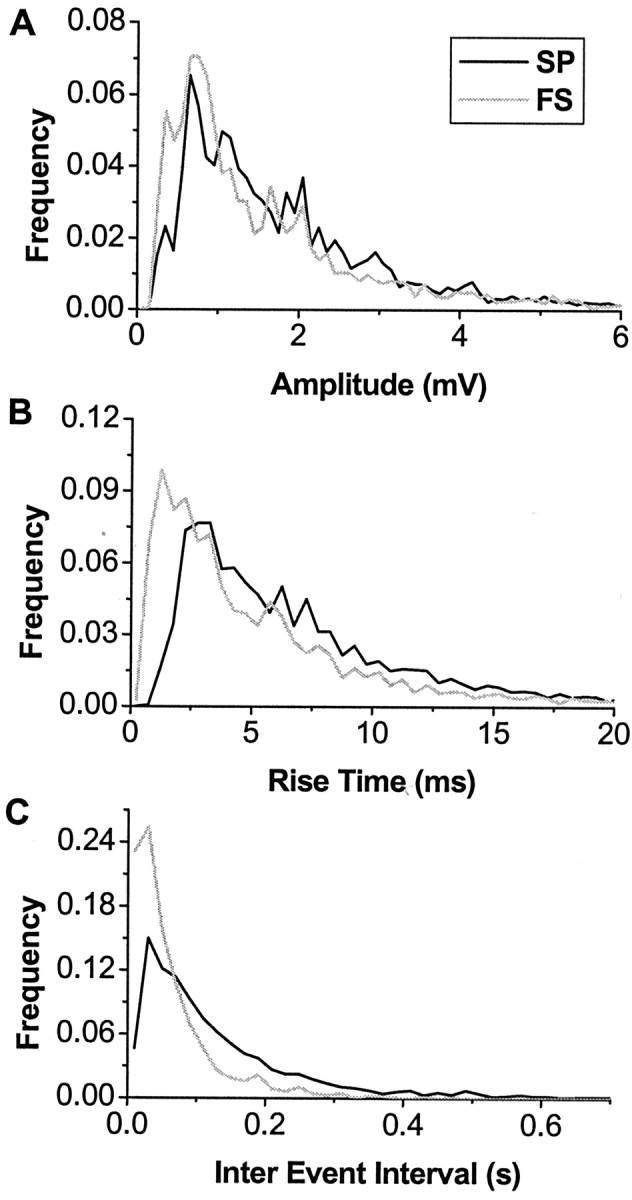
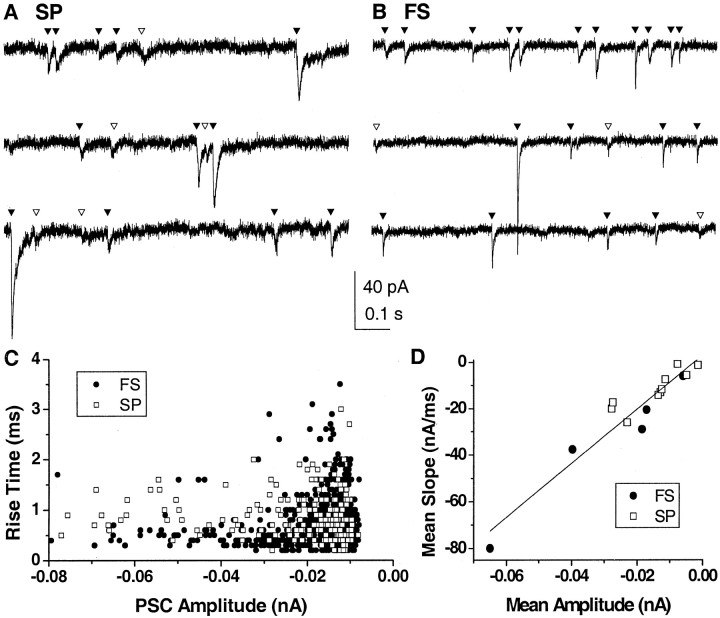
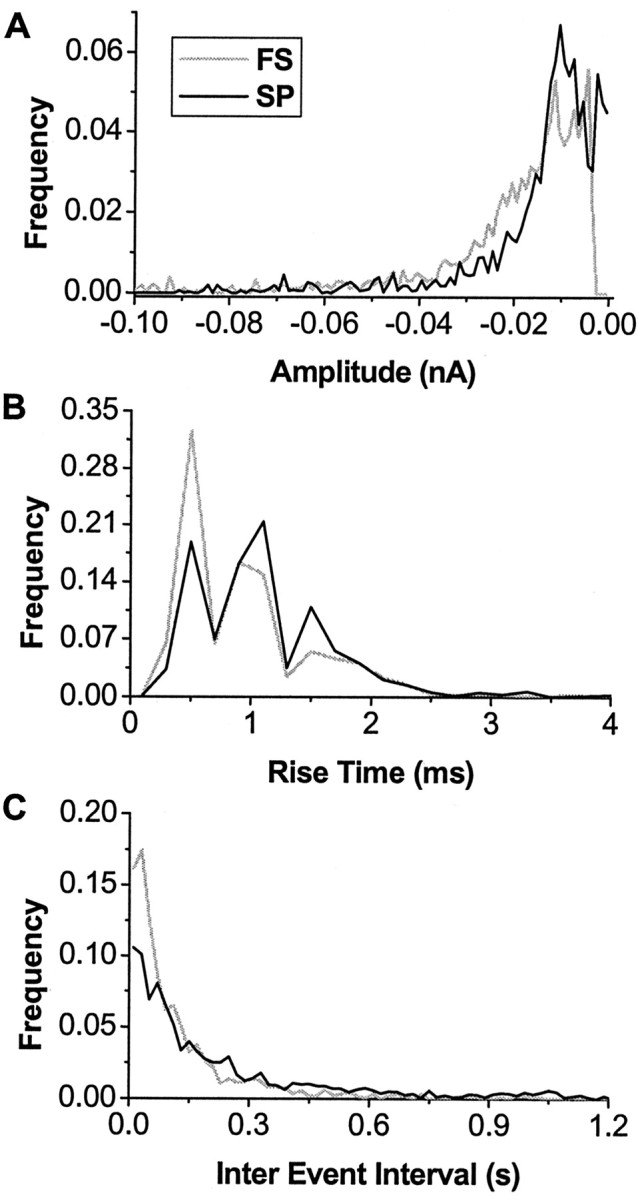
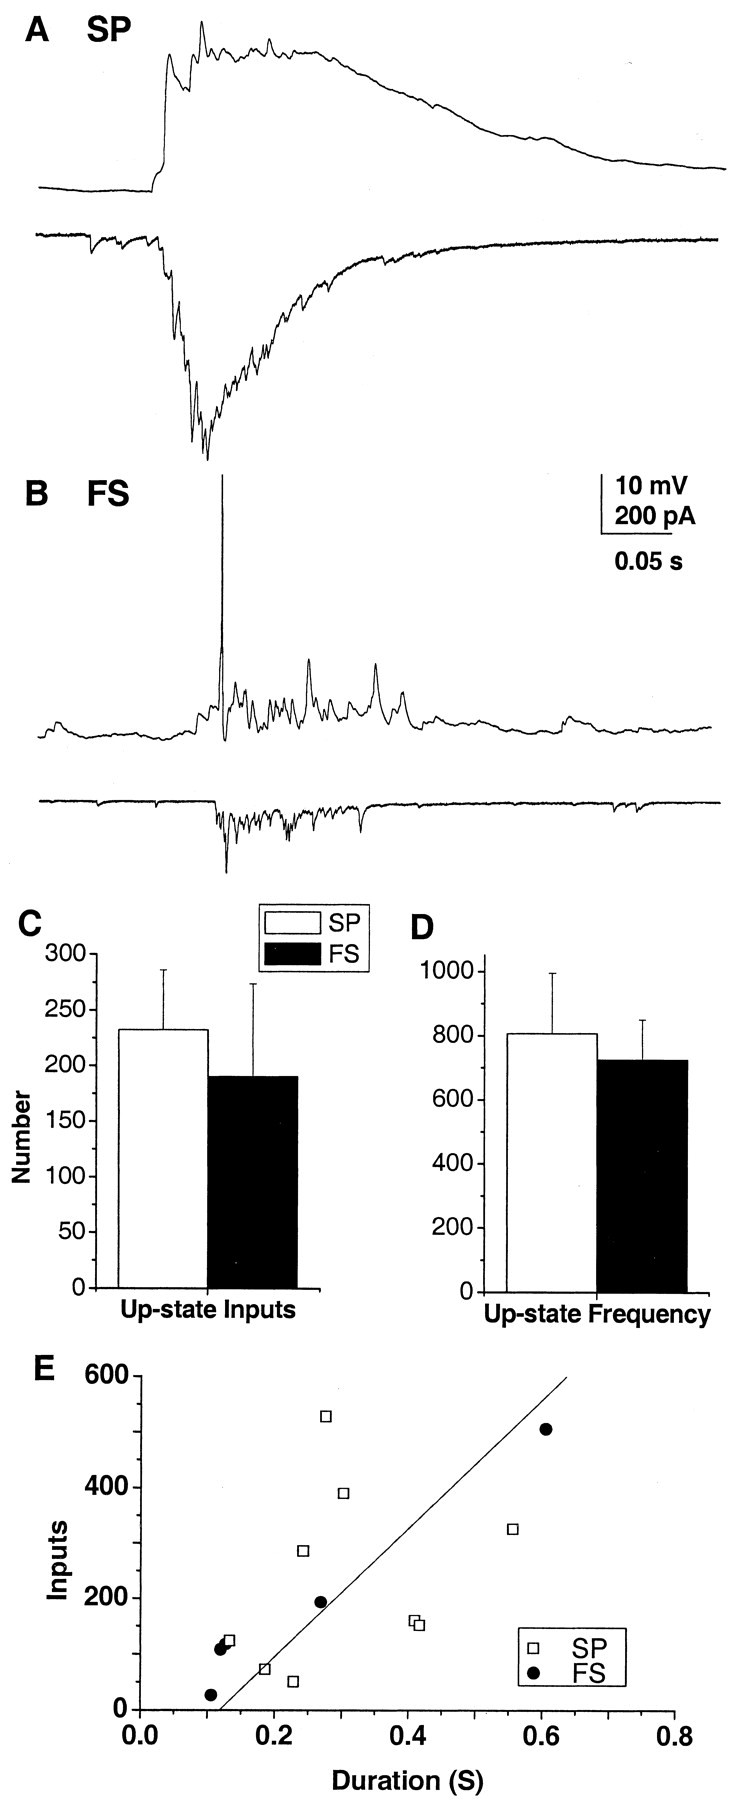
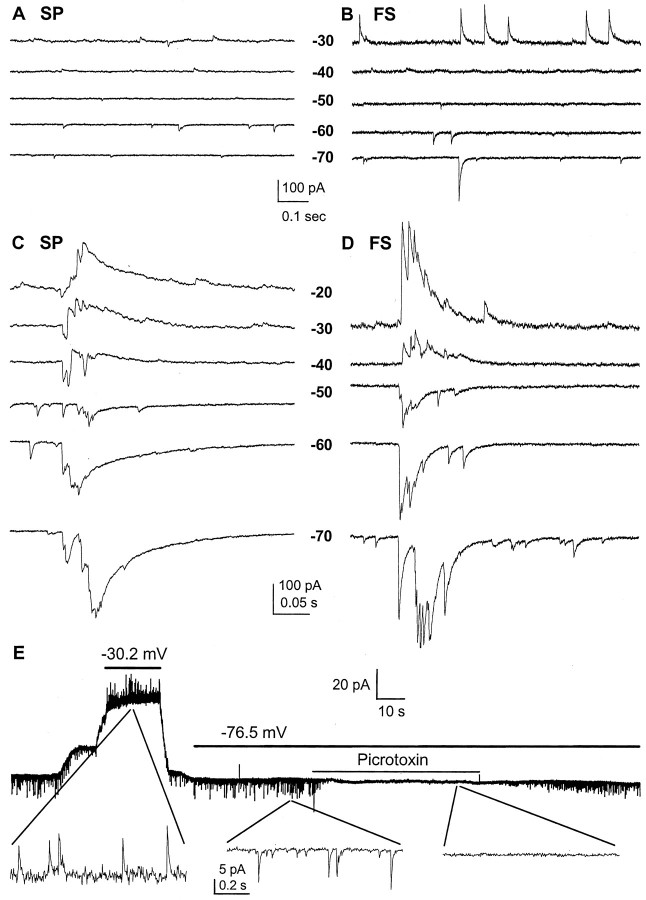
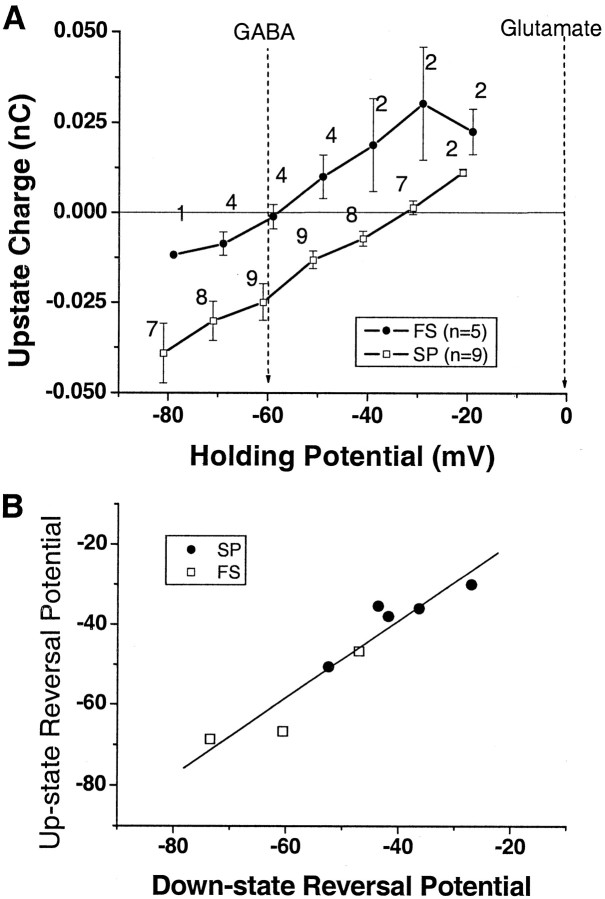
Up states are prolonged membrane potential depolarizations critical for synaptic integration and action potential generation in cortical and striatal neurons. They commonly result from numerous concurrent synaptic inputs, whereas neurons reside in a down state when synaptic inputs are few. By quantifying the composition, frequency, and amplitude of synaptic inputs for both states, we provide important constraints for state transitions in striatal network dynamics. Up and down states occur naturally in cortex-striatum-substantia nigra cocultures, which were used as an in vitro model in the present study. Spontaneous synaptic inputs during down states were extracted automatically in spiny projection neurons and fast spiking interneurons of the striatum using a newly developed computer algorithm. Consistent with a heterogeneous population of synaptic inputs, PSPs and PSCs showed no correlation in amplitude and rise time and occurred at relatively low frequencies of 10-40 Hz during the down state. The number of synaptic inputs during up states, estimated from the up-state charge and the unitary charge of down-state PSCs, was 217 +/- 44. Given the average up-state duration of 284 +/- 34 msec, synaptic input frequency was approximately 800 Hz during up-states for both neuronal types. Many down-state events reversed at the chloride reversal potential and were blocked by GABA(A) antagonists. The high correlation between up- and down-state reversal potential suggests that despite these drastic changes in synaptic input frequency, the ratio of inhibitory to excitatory currents is similar during both states.
Figures
Similar articles
-
A comparative voltage and current-clamp analysis of feedback and feedforward synaptic transmission in the striatal microcircuit in vitro.J Neurophysiol. 2006 Feb;95(2):737-52. doi: 10.1152/jn.00802.2005. Epub 2005 Oct 19. J Neurophysiol. 2006. PMID: 16236782
-
Up and down states in striatal medium spiny neurons simultaneously recorded with spontaneous activity in fast-spiking interneurons studied in cortex-striatum-substantia nigra organotypic cultures.J Neurosci. 1998 Jan 1;18(1):266-83. doi: 10.1523/JNEUROSCI.18-01-00266.1998. J Neurosci. 1998. PMID: 9412506 Free PMC article.
-
Functional and molecular development of striatal fast-spiking GABAergic interneurons and their cortical inputs.Eur J Neurosci. 2005 Sep;22(5):1097-108. doi: 10.1111/j.1460-9568.2005.04303.x. Eur J Neurosci. 2005. PMID: 16176351
-
Intrinsic and integrative properties of substantia nigra pars reticulata neurons.Neuroscience. 2011 Dec 15;198:69-94. doi: 10.1016/j.neuroscience.2011.07.061. Epub 2011 Aug 2. Neuroscience. 2011. PMID: 21839148 Free PMC article. Review.
-
GABAergic control of substantia nigra dopaminergic neurons.Prog Brain Res. 2007;160:189-208. doi: 10.1016/S0079-6123(06)60011-3. Prog Brain Res. 2007. PMID: 17499115 Review.
Cited by
-
Dopamine Oppositely Modulates State Transitions in Striosome and Matrix Direct Pathway Striatal Spiny Neurons.Neuron. 2020 Dec 23;108(6):1091-1102.e5. doi: 10.1016/j.neuron.2020.09.028. Epub 2020 Oct 19. Neuron. 2020. PMID: 33080228 Free PMC article.
-
Cortically activated interneurons shape spatial aspects of cortico-accumbens processing.J Neurophysiol. 2009 Apr;101(4):1876-82. doi: 10.1152/jn.91002.2008. Epub 2009 Jan 28. J Neurophysiol. 2009. PMID: 19176610 Free PMC article.
-
Differential tonic GABA conductances in striatal medium spiny neurons.J Neurosci. 2008 Jan 30;28(5):1185-97. doi: 10.1523/JNEUROSCI.3908-07.2008. J Neurosci. 2008. PMID: 18234896 Free PMC article.
-
Spike-train communities: finding groups of similar spike trains.J Neurosci. 2011 Feb 9;31(6):2321-36. doi: 10.1523/JNEUROSCI.2853-10.2011. J Neurosci. 2011. PMID: 21307268 Free PMC article.
-
Using potassium currents to solve signal-to-noise problems in inhibitory feedforward networks of the striatum.J Neurophysiol. 2006 Jan;95(1):331-41. doi: 10.1152/jn.00063.2005. Epub 2005 Sep 28. J Neurophysiol. 2006. PMID: 16192340 Free PMC article.
References
-
- Ankri N, Legendre P, Faber DS, Korn H ( 1994) Automatic detection of spontaneous synaptic responses in central neurons. J Neurosci Methods 52: 87-100. - PubMed
-
- Bauswein E, Fromm E, Preuss A ( 1989) Corticostriatal cells in comparison with pyramidal tract neurons: contrasting properties in the behaving monkey. Brain Res 493: 198-203. - PubMed
-
- Becq H, Bosler O, Geffard M, Enjalbert A, Herman JP ( 1999) Anatomical and functional reconstruction of the nigrostriatal system in vitro: selective innervation of the striatum by dopaminergic neurons. J Neurosci Res 58: 553-566. - PubMed
-
- Bennett BD, Bolam JP ( 1994) Synaptic input and output of parvalbumin-immunoreactive neurons in the neostriatum of the rat. Neuroscience 62: 707-719. - PubMed
-
- Carlson CG, Krieger JW ( 1996) A baseline detection method for analyzing transient electrophysiological events. J Neurosci Methods 67: 211-220. - PubMed
Publication types
MeSH terms
Substances
Grants and funding
LinkOut - more resources
Full Text Sources