. 2003 Oct 8;23(27):9171-84.
doi: 10.1523/JNEUROSCI.23-27-09171.2003.

Dorsal horn neurons firing at high frequency, but not primary afferents, release opioid peptides that produce micro-opioid receptor internalization in the rat spinal cord

Affiliations

Dorsal horn neurons firing at high frequency, but not primary afferents, release opioid peptides that produce micro-opioid receptor internalization in the rat spinal cord

Bingbing Song et al. J Neurosci. .

Abstract

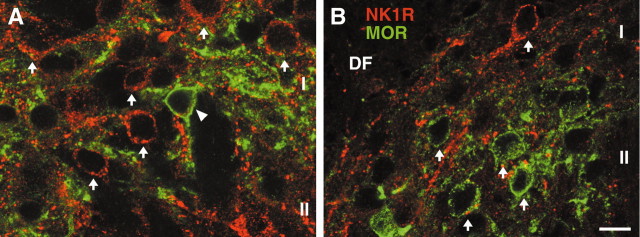
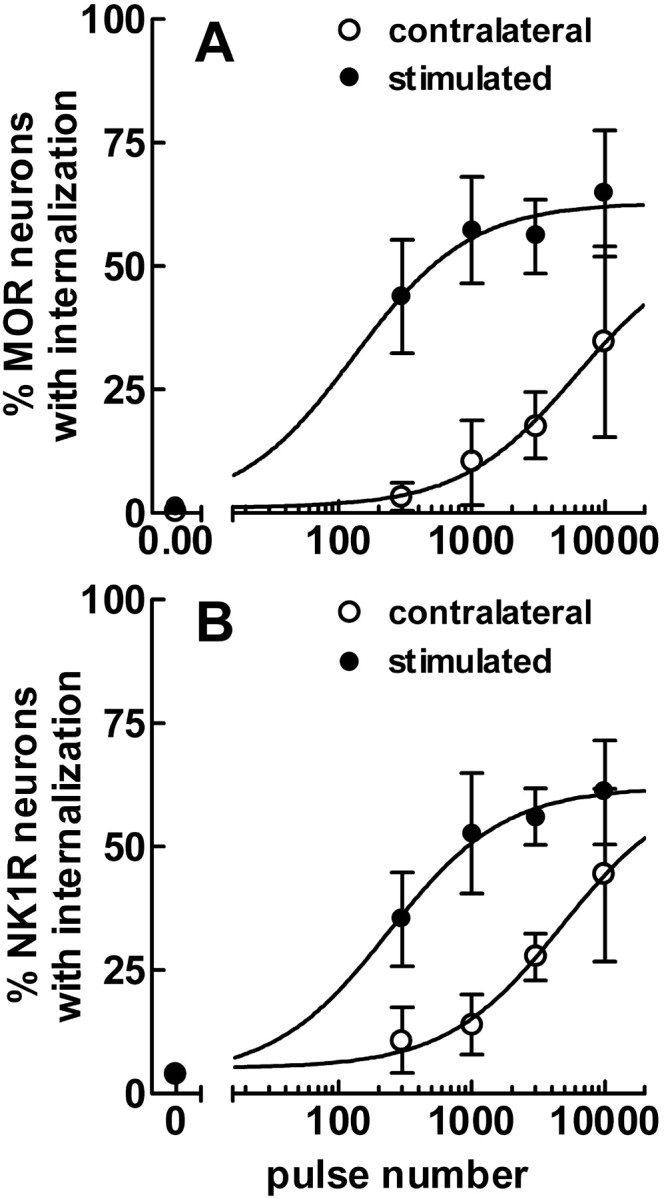
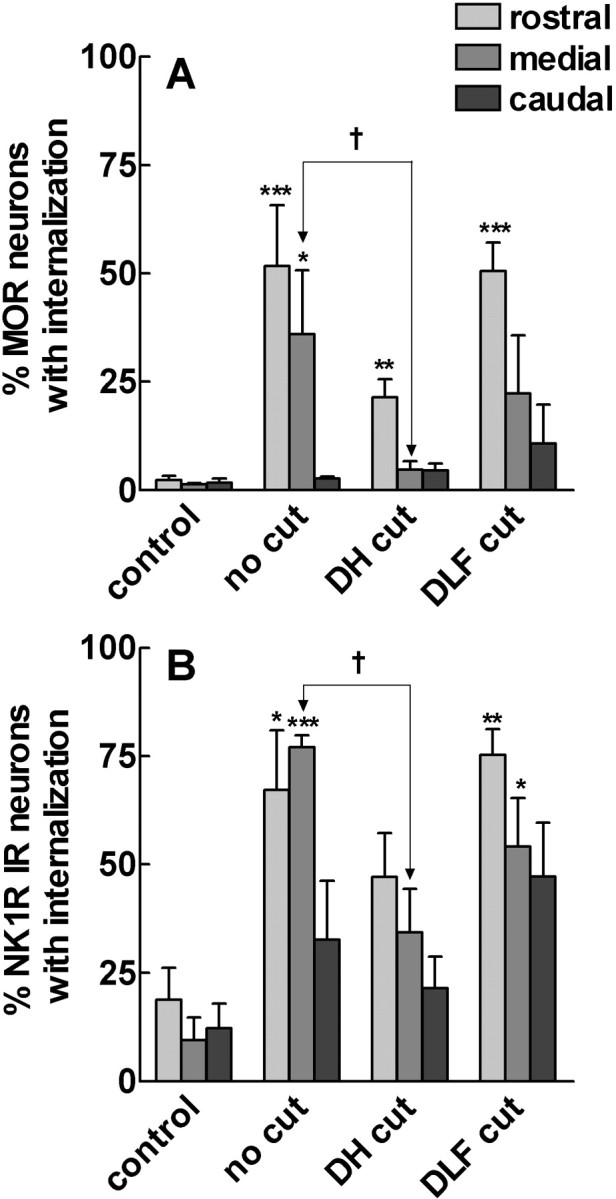
To determine what neural pathways trigger opioid release in the dorsal horn, we stimulated the dorsal root, the dorsal horn, or the dorsolateral funiculus (DLF) in spinal cord slices while superfusing them with peptidase inhibitors to prevent opioid degradation. Internalization of mu-opioid receptors (MOR) and neurokinin 1 receptors (NK1R) was measured to assess opioid and neurokinin release, respectively. Dorsal root stimulation at low, high, or mixed frequencies produced abundant NK1R internalization but no MOR internalization, indicating that primary afferents do not release opioids. Moreover, capsaicin and NMDA also failed to produce MOR internalization. In contrast, dorsal horn stimulation elicited MOR internalization that increased with the frequency, being negligible at <10 Hz and maximal at 500 Hz. The internalization was abolished by the MOR antagonist D-Phe-Cys-Tyr-D-Trp-Arg-Thr-Pen-Thr-NH2 (CTAP), in the presence of low Ca2+ and by the Na+ channel blocker lidocaine, confirming that it was caused by opioid release and neuronal firing. DLF stimulation in "oblique" slices (encompassing the DLF and the dorsal horn of T11-L4) produced MOR internalization, but only in areas near the stimulation site. Moreover, cutting oblique slices across the dorsal horn (but not across the DLF) eliminated MOR internalization in areas distal to the cut, indicating that it was produced by signals traveling in the dorsal horn and not via the DLF. These findings demonstrate that some dorsal horn neurons release opioids when they fire at high frequencies, perhaps by integrating signals from the rostral ventromedial medulla, primary afferents, and other areas of the spinal cord.


Figures

Figure 1.
Figure 1.
Dorsal root stimulation. Coronal spinal cord slices with one dorsal root were placed in a slice chamber and superfused with aCSF containing peptidase inhibitors for at least 2 min before stimulation. The root was drawn into a side compartment, placed on a bipolar electrode, and covered with mineral oil. Electrical stimulation consisted of 6000 pulses of 30 V and 0.4 msec delivered in three different patterns: single train at 5 Hz for 20 min (A); 60 trains of 100 pulses at 100 Hz every 10 sec (B); 1500 trains of 4 pulses at 100 Hz every 0.2 sec (TBS) (C). MOR and NK1R internalization were measured in laminas I-II and lamina I, respectively, of the dorsal horn ipsilateral (stimulated) or contralateral to the root. Data are the mean ± SEM of four slices (5 slices in B). Each panel was analyzed with a two-way ANOVA, the two variables being side (stimulated or contralateral) and receptor (MOR or NK1R). The effect of both variables and their interaction was significant (p < 0.0001) for A-C. Bonferroni's post-test revealed significant differences between the stimulated and contralateral sides for NK1R (***p < 0.001) but not for MOR.
Figure 2.
Figure 2.
Confocal images of MOR and NK1R neurons after dorsal root stimulation. Coronal spinal cord slices were superfused with peptidase inhibitors and stimulated at the dorsal root with 6000 pulses delivered at 5 Hz continuously, at 100 Hz in 60 trains, or as TBS (trains every 0.2 sec of 4 pulses at 100 Hz). Sections from the slices were double labeled for MOR (green) and NK1R (red). Dorsal is up. Roman numerals indicate the approximate position of laminas I-III. DF, Dorsal funiculus. Arrows and arrowheads indicate cells with and without internalization, respectively. A, No stimulation (contralateral to the root stimulated with TBS): five NK1R neurons and five MOR neurons in the central dorsal horn show no internalization. B, Stimulation at 5 Hz: two NK1R neurons in the medial dorsal horn show substantial internalization, whereas two MOR neurons show no internalization. C, Stimulation at 100 Hz: two NK1R neurons in lamina I of the central dorsal horn show abundant internalization, whereas three MOR neurons in lamina II show no internalization. D, Stimulation with TBS: two NK1R neurons in lamina III of the central dorsal horn show internalization, whereas a MOR neuron in lamina II shows no internalization. Confocal images were taken at 63× for A, C, and D (scale bar, 20 μm) and at 100× for B (scale bar, 12.5 μm) and consist of two optical sections separated 0.57 μm.
Figure 3.
Figure 3.
Confocal images of MOR and NK1R neurons after dorsal horn stimulation. Coronal spinal cord slices were superfused with peptidase inhibitors, and one dorsal horn was stimulated with a single train of 1000 pulses. Dorsal is up. Roman numerals indicate the approximate position of laminas I and II. DF, Dorsal funiculus. Arrows and arrowheads indicate cells with and without internalization, respectively. A, Stimulation at 3 Hz produced abundant NK1R internalization in this cluster of NK1R neurons, but no MOR internalization in the MOR neuron in the center of the image. B, Stimulation at 500 Hz produced MOR internalization in this cluster of MOR neurons and NK1R internalization in the neuron at the top of the image. Confocal images were taken at 100× (scale bar, 10 μm) and consist of two optical sections separated 0.57 μm.
Figure 4.
Figure 4.
Dorsal horn stimulation: pulse intensity. Coronal spinal cord slices were superfused with aCSF containing peptidase inhibitors. A hook stimulation electrode was positioned with its poles on either side of one of the dorsal horns (stimulated) and used to deliver 1000 pulses in a single train at 100 Hz. Pulses had a duration of 0.4 msec and intensities of 10-70 V, as indicated in the figure. For 0 V, slices were treated in the same way, but no current was passed through the electrode. Sections from the slices were double labeled for MOR and NK1R, and internalization of MOR in laminas I-II neurons (A) and NK1R in lamina I neurons (B) was measured in the same sections. Points represent the mean ± SEM of four to six slices. Two-way ANOVA for each panel revealed significant effects of side (i.e., stimulated versus contralateral; p < 0.0001) and pulse intensity (p < 0.01). Curves represent fitting of a saturation function to the data, yielding the following parameter values: MOR, stimulated side: Bmax = 64 ± 6% MOR neurons, KD = 7 ± 3 V; NK1R, stimulated side: Bmax = 59 ± 3% NK1R neurons, KD = 6 ± 2 V.
Figure 5.
Figure 5.
Dorsal horn stimulation: number of pulses. Coronal spinal cord slices were superfused with aCSF containing peptidase inhibitors. The stimulation electrode was positioned with its poles on either side of one of the dorsal horns (stimulated) and used to deliver a single train at 100 Hz with the indicated number of pulses (30 V, 0.4 msec). For 0 pulses, no current was passed through the electrode (same data as 0 V in Fig. 4). Sections from the slices were double labeled for MOR and NK1R, and internalization of MOR in laminas I-II neurons (A) and NK1R in lamina I neurons (B) was measured in the same sections. Points represent the mean ± SEM of three to six slices. Two-way ANOVA for each panel revealed significant effects (p < 0.001) of side (i.e., stimulated versus contralateral) and pulse number. Curves represent fitting of a sigmoidal dose-response function to the data, yielding the following parameter values: MOR, stimulated side: top = 63 ± 4% MOR neurons, EC50 = 131 pulses (95% C.I. = 28-606 pulses); NK1R, stimulated side: top = 62 ± 2% NK1R neurons, EC50 = 237 pulses (95% C.I. = 118-479 pulses).
Figure 6.
Figure 6.
Dorsal horn stimulation: frequency. Coronal spinal cord slices were superfused with aCSF containing peptidase inhibitors. The stimulation electrode was positioned with its poles on either side of one of the dorsal horns (stimulated) and used to deliver a single train of 1000 pulses (30 V, 0.4 msec) at the indicated frequencies. Sections from the slices were double labeled for MOR and NK1R, and internalization of MOR in laminas I-II neurons (A) and NK1R in lamina I neurons (B) was measured in the same sections. Points represent the mean ± SEM of three to six slices. Two-way ANOVA of the MOR internalization data revealed significant effects (p < 0.0001) of side (i.e., stimulated versus contralateral) and frequency and their interaction. Two-way ANOVA of the NK1R internalization data revealed a significant effects of side (p < 0.0001) but not of frequency. Curves represent fitting of a sigmoidal dose-response function, yielding the following parameter values for MOR (stimulated side): top = 84 ± 7% MOR neurons, EC50 = 53 Hz (95% C.I. = 19-144 Hz).
Figure 7.
Figure 7.
Confocal images of MOR neurons after dorsal horn stimulation. Coronal spinal cord slices were superfused with peptidase inhibitors alone (A-C) or with 10 μm CTAP (D), low Ca 2+ (0.2 mm) (E), or 1 mm lidocaine (F). One dorsal horn was stimulated (not stimulated for the control) (A) with a single train of 1000 pulses at 100 Hz (B), 1000 pulses at 500 Hz (C), or 3000 pulses at 100 Hz (D-F). MOR were not internalized in any of the four neurons in A (control). Internalization produced by 100 Hz stimulation is observed in two neurons in B but was abolished in the presence of CTAP (D), low Ca2+ (E), or lidocaine (F). Abundant internalization is observed after 500 Hz stimulation (C). Dorsal is up, and all neurons are in lamina II. Arrows and arrowheads indicate cells with and without internalization, respectively. Confocal images were taken at 100× (scale bar, 10 μm), except for A (63×; scale bar, 16 μm), and consist of two optical sections (3 in C) separated 0.57 μm.
Figure 8.
Figure 8.
Presence of opioids in the DLF. Horizontal sections from rat spinal cord were labeled with monoclonal antibody 3E7, which recognizes endorphins, enkephalins, and dynorphins. A, Low-magnification (20×; scale bar, 50 μm) image of the DLF consisting of three optical sections 2.5 μm apart; 3E7-immunoreactive fibers are seen running in the rostrocaudal direction. The box represents the approximate location of the image in B. B, High-magnification (100×; scale bar, 10 μm) image consisting of three optical sections 0.57 μm apart; 3E7-immunoreactive fibers run mostly parallel and contain some intensely labeled puncta.
Figure 9.
Figure 9.
DLF stimulation in oblique slices. Oblique spinal cord slices were superfused with aCSF containing peptidase inhibitors. Some of the slices were left intact (no cut), whereas others were partially cut between T13 and L1, either across the entire width of the dorsal horn (DH cut) or across the entire width of the DLF (DLF cut). A bipolar electrode was positioned at T12 with its poles on either side of the DLF. In control slices no current was passed; all other slices were stimulated with 6000 pulses (20 V, 0.4 msec) delivered at 100 Hz in 60 trains of 100 pulses, 1 train every 10 sec. After fixation, slices were cut into three portions comprising segments T11-T13 (rostral, where the electrode was placed and rostral to the cut), L1-L2 (medial), and L3-L4 (caudal). Sections from these portions were double labeled for MOR and NK1R, and internalization of MOR in laminas I-II neurons (A) and NK1R in lamina I neurons (B) was measured in the same sections. Data are the mean ± SEM of three to five slices. Each panel was analyzed with a two-way ANOVA, and significant effects were found for the two variables stimulation (control, no cut, DH cut, or DLF cut; p < 0.001) and portion (rostral, medial or caudal; p < 0.0001 for MOR; p < 0.01 for NK1R) but not their interaction. Bonferroni's post-test revealed the significant differences from control indicated by the asterisks (*p < 0.05; **p < 0.01; ***p < 0.001), and significant differences between the medial portions of no cut versus DH cut ( p < 0.05).
Figure 10.
Figure 10.
Confocal images of MOR and NK1R dorsal horn neurons after DLF stimulation. Oblique spinal cord slices were left intact (A, B), cut at T13 across the dorsal horn (C), or cut at T13 across the DLF (D). Slices were superfused with peptidase inhibitors, and a stimulation electrode was positioned on the DLF at T12. A, Control: no current was passed. B-D, Slices were stimulated with 6000 pulses in 60 trains at 100 Hz. Sections from the slices were double labeled for MOR (green) and NK1R (red). Images are from the medial portion (segments L1-L2), an area situated on the other side of the cut (in C and D) from the stimulation site. Roman numerals indicate the approximate position of laminas I-III. Arrows and arrowheads indicate cells with and without internalization, respectively. Confocal images were taken at 100× for A and B (scale bar, 10 μm) and at 63× for C and D (scale bar, 16 μm) and consist of two optical sections, except for B (3 optical sections). Little MOR or NK1R internalization was observed in control slices (A). Substantial MOR and NK1R internalization was observed after DLF stimulation (B), even when the DLF was cut (D), but not when the dorsal horn was cut (C).
Figure 11.
Figure 11.
DLF stimulation in the presence of GABAA and glycine antagonists. Oblique spinal cord slices were cut across the entire width of the dorsal horn at T13 and superfused with peptidase inhibitors alone (control; same data as DH cut in Fig. 9, included here for comparison) or with 5 μm bicuculline and 2 μm strychnine (bicuc+strych). A bipolar electrode was positioned at T12 with its poles on either side of the DLF and used to stimulate the slices with 6000 pulses (20 V, 0.4 msec) delivered at 100 Hz in 60 trains of 100 pulses. Slices were cut into three portions comprising segments T11-T13 (rostral, where the electrode was placed and rostral to the cut), L1-L2 (medial), and L3-L4 (caudal). Sections from these portions were double labeled for MOR and NK1R, and internalization of MOR in laminas I-II neurons (A) and NK1R in lamina I neurons (B) was measured in the same sections. Data are the mean ± SEM of five to six slices. Each panel was analyzed with a two-way ANOVA, the two variables being drug (control vs bicuc+strych) and portion (rostral, medial, and caudal). Only the variable portion had a significant effect (p < 0.01). Bonferroni's post-test revealed no significant effect of drug for any of the three portions.

Similar articles

Cited by

References

    1. Abbadie C, Trafton J, Liu H, Mantyh PW, Basbaum AI ( 1997) Inflammation increases the distribution of dorsal horn neurons that internalize the neurokinin-1 receptor in response to noxious and non-noxious stimulation. J Neurosci 17: 8049-8060. - PMC - PubMed
    1. Abbadie C, Pasternak GW, Aicher SA ( 2001) Presynaptic localization of the carboxy-terminus epitopes of the mu opioid receptor splice variants MOR-1C and MOR-1D in the superficial laminae of the rat spinal cord. Neuroscience 106: 833-842. - PubMed
    1. Afrah AW, Stiller CO, Olgart L, Brodin E, Gustafsson H ( 2001) Involvement of spinal N-methyl-d-aspartate receptors in capsaicin-induced in vivo release of substance P in the rat dorsal horn. Neurosci Lett 316: 83-86. - PubMed
    1. Aimone LD, Yaksh TL ( 1989) Opioid modulation of capsaicin-evoked release of substance P from rat spinal cord in vivo. Peptides 10: 1127-1131. - PubMed
    1. Allen BJ, Rogers SD, Ghilardi JR, Menning PM, Kuskowski MA, Basbaum AI, Simone DA, Mantyh PW ( 1997) Noxious cutaneous thermal stimuli induce a graded release of endogenous substance P in the spinal cord: imaging peptide action in vivo J Neurosci 17: 5921-5927. - PMC - PubMed

Publication types

MeSH terms