. 2003 Oct 8;23(27):9254-62.
doi: 10.1523/JNEUROSCI.23-27-09254.2003.

Signaling at the gliovascular interface

Affiliations

Signaling at the gliovascular interface

Marie Simard et al. J Neurosci. .

Abstract

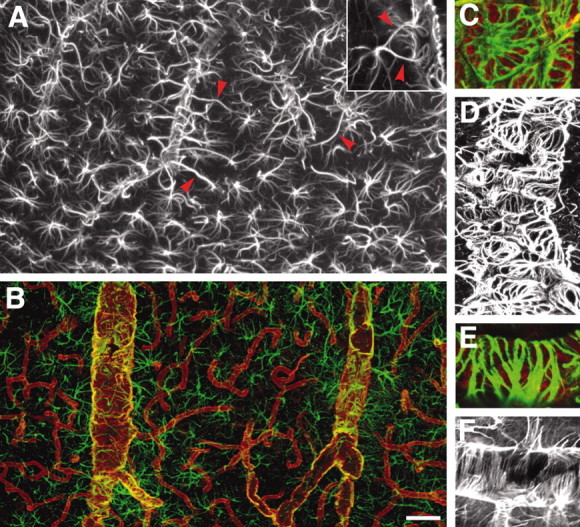
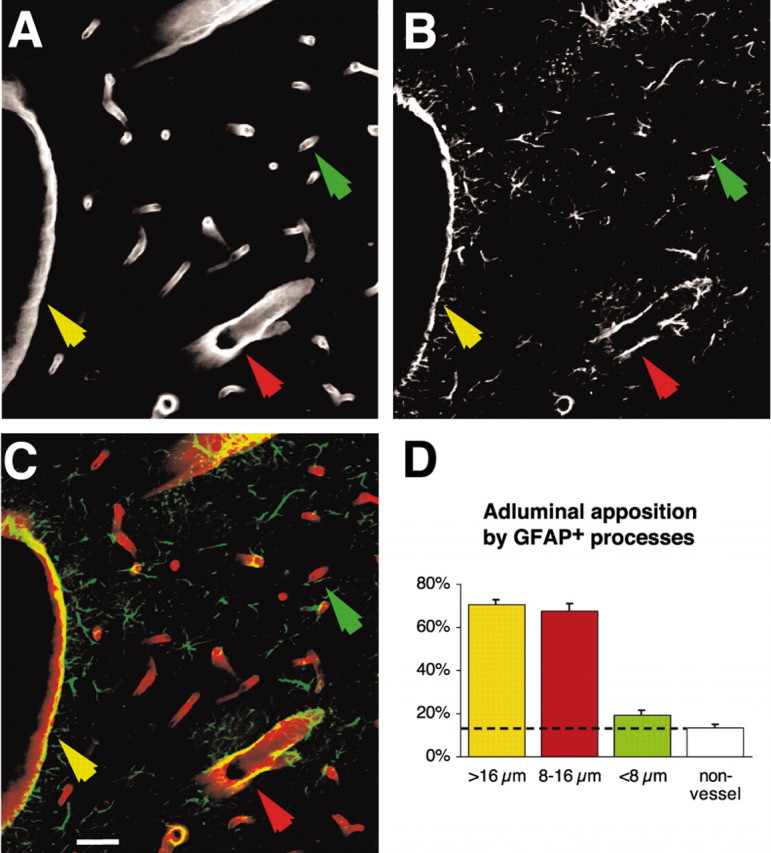
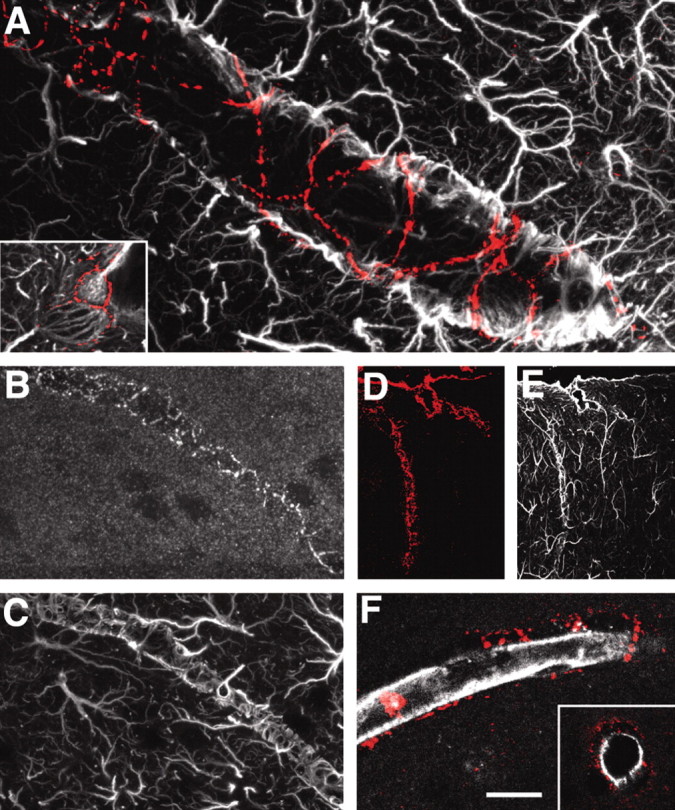
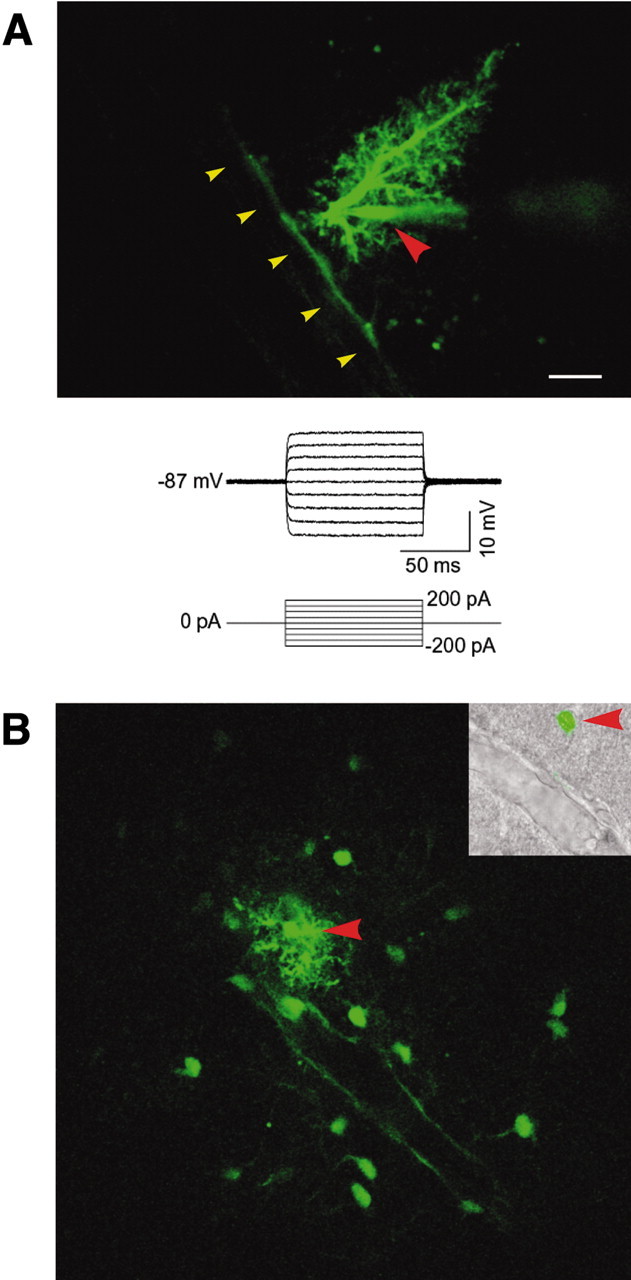
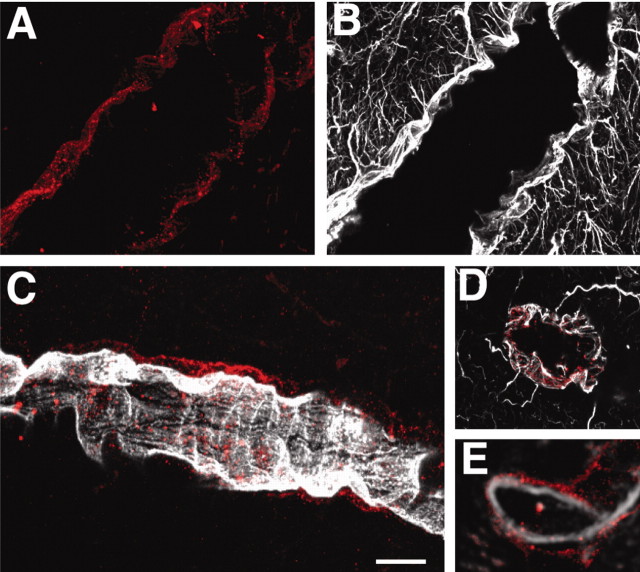
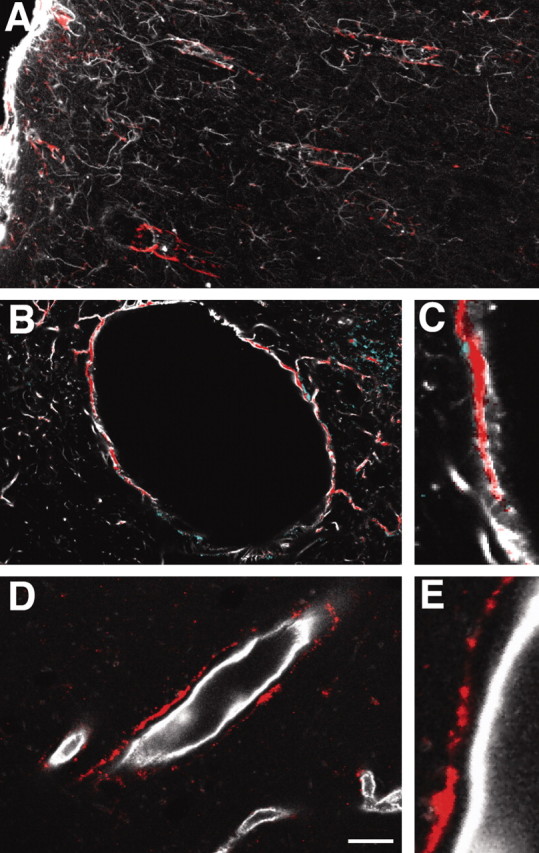
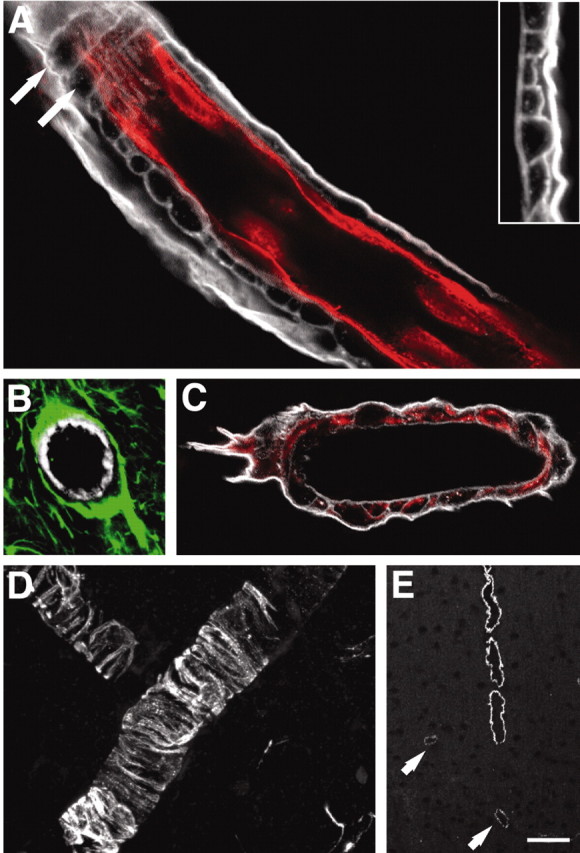
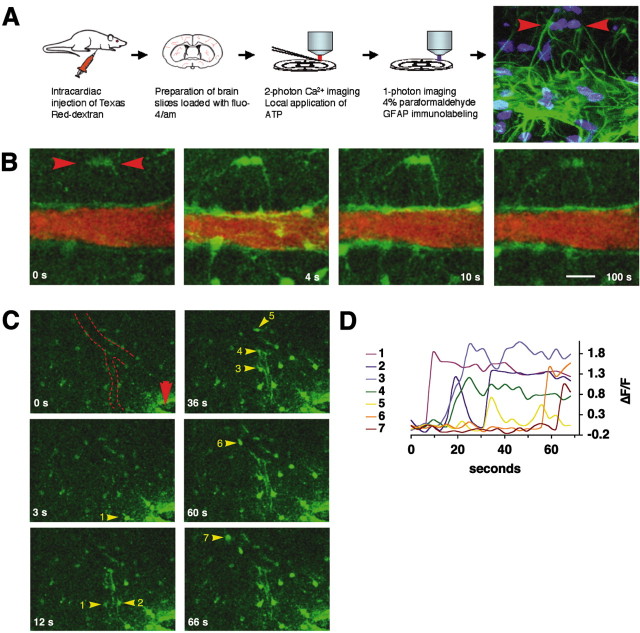
Advances in fluorescent calcium indicating dyes over the past decade have identified calcium signaling as the tool by which astrocytes communicate among themselves and with neighboring neurons. Studies of astrocyte-neuron interactions have shown that calcium signaling is a potent modulator of the strength of both excitatory and inhibitory synapses. The concept that astrocytes possess a mechanism for rapid cell communication has not been incorporated, however, into the supportive functions of astrocytes. Because many of the classical tasks of astrocytes are linked to the blood-brain barrier, we have here examined the expression of proteins required for calcium signaling in their vascular end-foot processes. The gap junction protein, Cx43, was expressed intensively around the vessels interconnecting astrocytic end-foot processes. These gap junctions permitted diffusion of Lucifer yellow, specifically along the path of glial end feet apposed to the vessel wall. The purinergic receptors, P2Y(2) and P2Y(4), were also strongly expressed at the gliovascular interface and colocalized with GFAP around larger vessels in cortex. Multiphoton imaging of freshly prepared brain slices loaded with Fluo-4/AM revealed that ATP mobilized cytosolic calcium in astrocytic end feet, whereas electrical stimulation triggered calcium waves propagating along the vessel wall. Brain endothelial cells and pericytes were physically separated from astrocytes by the basal lamina and responded only weakly to ATP. These observations identify astrocytic end-foot processes plastered at the vessel wall as a center for purinergic signaling. It is speculated that calcium signaling may play a role in astrocytic functions related to the blood-brain barrier, including blood flow regulation, metabolic trafficking, and water homeostasis.


Figures

Figure 1.
Figure 1.
Not all vascular astrocytic end-foot processes are GFAP positive. A, GFAP immunolabeling of astrocytes in cortex. Individual astrocytes are star-shaped and distributed symmetrically, with minimal contact with neighboring astrocytes. Vascular processes differ from other processes by being straight, unbranched, and of wide diameter (red arrowheads). The surfaces of large to medium-size vessels were densely covered by GFAP+ astrocytic end feet. Inset, An astrocyte with two vascular processes. B, Double immunolabeling of AQP-4 (red) and GFAP (green). Aquaporin-4 immunolabeling reveals that the entire network of vessels, including capillaries, is covered by astrocytic processes, albeit GFAP negative. Smaller vessels and capillaries are mostly GFAP negative but display intense labeling against the astrocyte-specific channel AQP-4. The AQP-4 labeling reveals continuous coverage by astrocytic end feet. C-F, Examples of organization of GFAP in astrocytic end feet around larger vessels. C and D display examples of wagon-wheel or rosette formation of GFAP filaments in the vascular end feet, whereas E and F are examples on parallel arrays running perpendicular to the length of the vessel. C and E are double labeled against GFAP (green) and AQP-4 (red), whereas D and F are stained against GFAP only. Scale bar: inset, 40 μm; A, 10 μm; B, 60 μm; C, E, 5 μm; D, F, 30 μm.
Figure 2.
Figure 2.
Quantification of GFAP expression in astrocytic end feet plastered at the vessel wall. A-C, Double immunostaining against laminin (A) and GFAP (B) and overlay (C) of laminin (red) and GFAP (green) in cortex. Scale bar, 20 μm. D, Quantification of GFAP expression along the vasculature as a function of the vessel size. Approximately 70% of the vessel wall of larger (>16 μm; yellow arrow) and medium-size (8-16 μm; red arrow) vessels were covered by GFAP+ astrocytic end feet. In contrast, only 19 ± 2% of astrocytic processes in contact with small vessels (<8 μm; green arrow) were GFAP+. This percentage of GFAP expression around small vessels did not differ significantly from the percentage of GFAP expression outside the vessel wall (13 ± 2% non-vessel; p = 0.33; unpaired t test). *p < 0.0001; unpaired t test; n = 10 slices.
Figure 3.
Figure 3.
Cx43 gap junction plaques are localized primarily around vessels and connect the end feet of astrocytes. A, Double immunolabeling against GFAP (white) and Cx43 (red). Cx43-immunoreactive plaques formed a spider web pattern around a medium-size vessel. Inset, High-power image illustrating the distribution of Cx43-immunoreactive plaques around an astrocytic foot process. B, C, Double immunolabeling against Cx43 (B) and GFAP. Large Cx43-immunoreactive plaques interconnect astrocytic GFAP-positive end feet. D, E, Intense Cx43 immunoreactivity in pia and penetrating vessels in cortex; labeling against Cx43 (D, red) and GFAP (E, white). F, Cx43 immunolabeling (red) does not colocalize with an endothelial cell marker, rat endothelial cell antigen (RECA; white); rather, Cx43 is localized outside the RECA-positive cells, consistent with the coexpression of Cx43 and GFAP in astrocytes. Scale bar: inset, 15 μm; A, 4 μm; B, C, 50 μm; D, E, 120 μm; F, 40 μm.
Figure 4.
Figure 4.
Functional coupling of astrocytic end feet visualized by diffusion of Lucifer yellow. A, An astrocyte filled with the gap junction-permeable indicator Lucifer yellow in a freshly prepared cortical slice. Lucifer yellow diffused preferentially along the vessel wall. Red arrowhead indicates Lucifer yellow-filled pipette; yellow arrowheads indicate vessel wall. Current injection failed to evoke action potentials (bottom panel). B, Another example of intercellular diffusion of Lucifer yellow along the vessel wall. An astrocyte was filled with Lucifer yellow by a patch electrode (red arrowhead), resulting in extensive intercellular diffusion into neighboring astrocytes and an outlining of their processes plastered around a vessel. Inset, After multiphoton imaging, the slice was fixed and visualized under DIC optics and fluorescence microscopy to depict the position of the Lucifer yellow-filled astrocyte (red arrow-head) in relation to the vessel (yellow arrowhead).
Figure 5.
Figure 5.
P2Y(2) is expressed at the gliovascular interface by astrocytic end feet. A, B, P2Y(2) immunoreactivity around a large vessel (A, red) and GFAP expression in the same field (B, white). C, Double immunoreactivity against P2Y(2) (red) and RECA (white). P2Y immunoreactivity is localized around the RECA-positive endothelial cells. D, Cross section of a GFAP-positive vessel counterstained against P2Y(2) receptors showing colocalization (red). E, In comparison, P2Y(2) expression (red) is localized outside the endothelial cell layer (RECA; white) in another cross section. Scale bar: A, B, 20 μm; C, 35 μm; D, E, 40 μm.
Figure 6.
Figure 6.
P2Y(4) immunolabeling is strongly coexpressed with GFAP in astrocytic processes. A, Double immunolabeling against P2Y(4) (red) and GFAP (white) in cortex. Penetrating larger GFAP+ vessels display intense labeling against the P2Y(4) receptor. B, Transverse section of larger vessels displaying colocalization of the P2Y(4) receptors and GFAP. C, High magnification of B. D, E, Double immunolabeling against P2Y(4) and RECA. The P2Y(4) immunolabeling is localized outside the endothelial cell layer consistent with its expression in astrocytes. Scale bar: A, 100 μm; B, 15 μm; C, E, 10 μm; D, 30 μm.
Figure 7.
Figure 7.
The basal lamina physically separates all three cell types of the blood-brain barrier. A, Double immunolabeling against laminin (white) and RECA (red) of a large cortical vessel. The basal lamina consists of an outer thick lamina intensively immunoreactive for laminin and an inner lamina that displays weaker staining for laminin. The inner lamina contains pockets, which often are shaped as tunnels running perpendicular to the length of the vessel (white arrows). Inset, High-power image of a laminin-stained vessel wall illustrating the two laminas. B, Large vessel stained against laminin (white) and GFAP (green). GFAP-positive astrocytic end feet cover the basal lamina. C, Desmin-positive pericytes (red) are localized in pockets of the basal lamina (laminin; white). D, High-power view of desmin-positive pericytes. E, An antibody directed against actin smooth muscle (pericyte specific) demonstrates that only large vessels are surrounded by pericytes. Pericytes are absent from the capillary wall, and only weak expression is observed in medium-size vessels (white arrows). Scale bar: A, 20 μm; B, 30 μm; C, 20 μm; D, 40 μm; E, 100 μm.
Figure 8.
Figure 8.
Purinergic receptor agonists mobilize cytosolic Ca 2+ in astrocytic end-foot processes. A, Preparation of freshly prepared cortical brain slices (P15) used for multiphoton imaging. Last frame visualizes GFAP immunoreactivity (green) and nuclear staining (Sytox, blue) of the same slide used for Ca 2+ imaging in B. Red arrowheads depict two GFAP-positive astrocytes with vascular processes that responded to ATP exposure. B, Increases in cytosolic Ca 2+ evoked by local application of ATP (100 μm) around the same vessel. The vessels were visualized by intracardial injection of Texas Red Dextran immediately before slide preparation. Fluo-4/AM is in green; Texas Red Dextran is in red. Red arrowheads depict the GFAP-positive astrocytes in A, last frame. C, Focal field stimulation (2 sec pulse, 100 Hz, 100 μA) evokes a Ca 2+ wave that propagates along the vessel wall (red arrowhead indicates stimulation electrode; dotted line indicates medium-sized vessel). Astrocytes engaged in the Ca 2+ wave are indicated by yellow arrowheads and numbered according the sequence that they engage in Ca 2+ signaling. D, Relative increases in Fluo-4/AM signal (ΔF/F) of the astrocytes numbered in C. Scale bar: A, B, 20 μm; C, 40 μm.

References

    1. Anderson C, Nedergaard M ( 2003) Astrocyte-mediated control of cerebral microcirculation. Trends Neurosci 26: 340-344. - PubMed
    1. Araque A, Parpura V, Sanzgiri RP, Haydon PG ( 1998) Glutamate-dependent astrocyte modulation of synaptic transmission between cultured hippocampal neurons. Eur J Neurosci 10: 2129-2142. - PubMed
    1. Arcuino G, Lin JH, Takano T, Liu C, Jiang L, Gao Q, Kang J, Nedergaard M ( 2002) Intercellular calcium signaling mediated by point-source burst release of ATP. Proc Natl Acad Sci USA 99: 9840-9845. - PMC - PubMed
    1. Ballard HJ, Achike FI ( 1998) Mechanism of action of prostaglandin E2 in the dog skeletal muscle circulation. Chin Med J (Engl) 111: 945-950. - PubMed
    1. Bezzi P, Carmignoto G, Pasti L, Vesce S, Rossi D, Rizzini BL, Pozzan T, Volterra A ( 1998) Prostaglandins stimulate calcium-dependent glutamate release in astrocytes. Nature 391: 281-285. - PubMed

Publication types

MeSH terms

LinkOut - more resources