. 2003 Oct 28;100(22):13025-9.
doi: 10.1073/pnas.2133370100. Epub 2003 Oct 8.

Cyclothiazide potently inhibits gamma-aminobutyric acid type A receptors in addition to enhancing glutamate responses

Affiliations

Cyclothiazide potently inhibits gamma-aminobutyric acid type A receptors in addition to enhancing glutamate responses

Lunbin Deng et al. Proc Natl Acad Sci U S A. .

Abstract

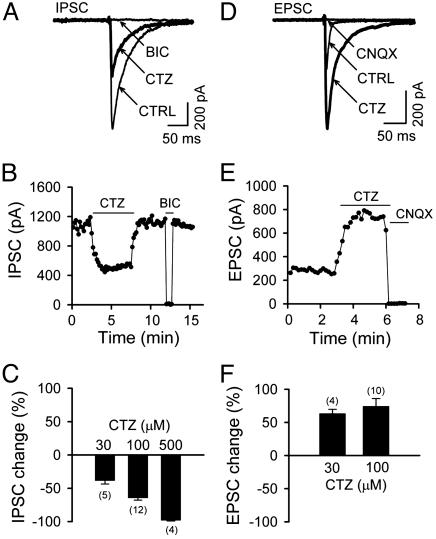
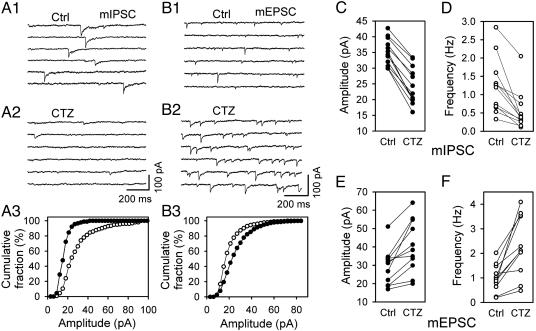
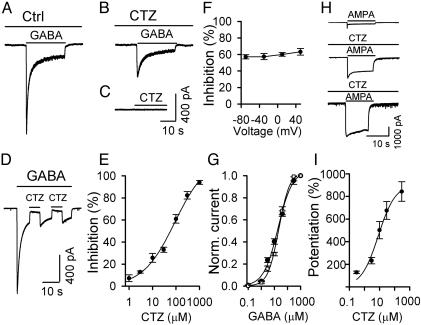
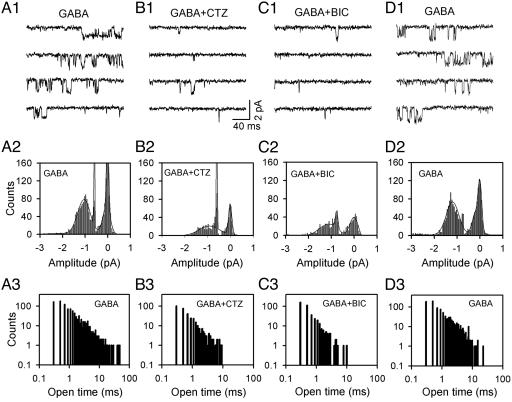
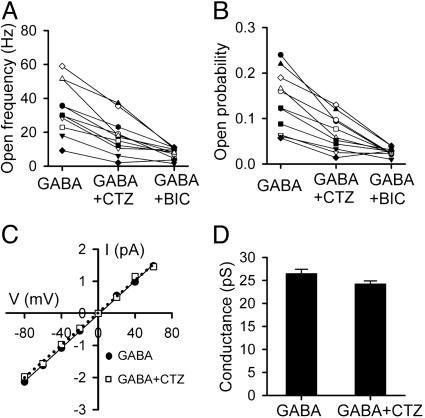
Ionotropic glutamate and gamma-aminobutyric acid type A (GABAA) receptors mediate critical excitatory and inhibitory actions in the brain. Cyclothiazide (CTZ) is well known for its effect of enhancing glutamatergic transmission and is widely used as a blocker for alpha-amino-3-hydroxy-5-methyl-4-isoxazolepropionic acid (AMPA)-type glutamate receptor desensitization. Here, we report that in addition to its action on AMPA receptors, CTZ also exerts a powerful but opposite effect on GABAA receptors. We found that CTZ reversibly inhibited both evoked and spontaneous inhibitory postsynaptic currents, as well as GABA application-induced membrane currents, in a dose-dependent manner. Single-channel analyses revealed further that CTZ greatly reduced the open probability of GABAA receptor channels. These results demonstrate that CTZ interacts with both glutamate and GABAA receptors and shifts the excitation-inhibition balance in the brain by two independent mechanisms. Understanding the molecular mechanism of this double-faceted drug-receptor interaction may help in designing new therapies for neurological diseases.


Figures

Fig. 1.
Fig. 1.
CTZ potently inhibits IPSCs but enhances EPSCs. (A) A typical example showing evoked autaptic IPSCs (average five to eight traces) in control (CTRL), 100 μM CTZ, and specific GABAA receptor antagonist BIC (40 μM). Holding potential was -70 mV. (B) Time-effect plot illustrating the amplitude of IPSCs reversibly blocked by CTZ and BIC. (C) Pooled data showing that CTZ inhibited IPSCs in a dose-dependent manner. (D and E) CTZ (100 μM) enhanced the amplitude and prolonged the decay of evoked autaptic EPSCs in a representative neuron. CNQX, 6-cyano-7-nitroquinoxaline-2,3-dione. (F) Pooled data showing the percentage of EPSC amplitude increase by CTZ.
Fig. 2.
Fig. 2.
CTZ decreases spontaneous mIPSCs but increases mEPSCs. (A1) Consecutive traces showing control (Ctrl) mIPSCs. (A2) CTZ (100 μM) greatly inhibited mIPSCs. (A3) Cumulative fraction plot illustrating the decrease of mIPSC amplitude in the presence of CTZ (P < 0.001, Kolmogorov–Smirnov test; ○, Ctrl; •, CTZ). (B1) Typical example showing Ctrl mEPSCs. (B2) CTZ (100 μM) significantly enhanced mEPSCs. (B3) Cumulative fraction plot demonstrating the increase of mEPSC amplitude in the presence of CTZ (P < 0.001; ○, Ctrl; •, CTZ). (C) Pooled data showing consistent reduction of mIPSC amplitude by CTZ. (D) Pooled data showing marked reduction of mIPSC frequency by CTZ. (E) Pooled data illustrating significant enhancement of mEPSC amplitude by CTZ. (F) Pooled data illustrating remarkable increase of mEPSC frequency by CTZ. P < 0.001, paired t test for CF.
Fig. 3.
Fig. 3.
CTZ blocks GABA-induced postsynaptic receptor responses. (A) Control (Ctrl) trace showing an inward current induced by bath application of GABA (40 μM). (B) CTZ (100 μM) inhibited the GABA-induced membrane current significantly. (C) Application of CTZ (100 μM) alone did not induce any membrane currents. (D) CTZ blocked the GABA-induced current instantaneously during rapid switch between GABA and GABA plus CTZ application. (E) Dose–response curve of CTZ inhibition on the peak amplitude of GABA-evoked inward currents. IC50 = 57.6 μM. (F) CTZ (100 μM) inhibition of GABA-evoked currents at different holding potentials. No significant difference was detected (P > 0.36, one-way ANOVA). (G) GABA dose–response curve in the absence (•) and presence (□) of CTZ (100 μM). EC50GABA = 18.8 μM. EC50GABA+CTZ = 22.2 μM. (H) Representative traces showing inward currents induced by bath application of AMPA (10 μM, Top), AMPA plus 10 μM CTZ (Middle), and AMPA plus 300 μM CTZ (Bottom). (I) Dose–response curve of CTZ potentiation of AMPA-evoked peak currents. EC50 = 10.4 μM. The number of experiments in EG and I ranged from four to nine, with the majority being six or seven.
Fig. 4.
Fig. 4.
CTZ inhibits GABAA receptor single-channel activity. (A1) Representative traces showing single-channel currents activated by bath perfusion of GABA (2 μM) from an outside-out patch. Channel openings are downward. (A2) The amplitude-distribution histogram of GABA-activated single-channel currents. (A3) The open time-distribution histogram of GABA-activated single-channel currents. (B1–B3) Representative traces (B1), amplitude histogram (B2), and open time-distribution histogram (B3) of single-channel currents in the presence of GABA plus CTZ (100 μM). Note a great reduction in the number of open events and a disappearance of long openings (>10 ms) in the presence of CTZ. (C1–C3) Representative traces (C1), amplitude histogram (C2), and open time-distribution histogram (C3) of single-channel currents in the presence of GABA plus BIC (40 μM). (D1–D3) Recovery of GABA-evoked single-channel events after washing off the drugs. All results in AD were obtained from the same patch with the holding potential at -70 mV.
Fig. 5.
Fig. 5.
CTZ reduced the GABAA receptor channel NPo without marked effect on the channel conductance. (A) The channel open frequency was consistently reduced by CTZ (100 μM) and BIC (40 μM). (B) The channel NPo was also similarly reduced by CTZ and BIC (P < 0.001, for both CTZ and BIC in A and B). (C) Current–voltage (I–V) curve showing similar main GABAA receptor channel conductance (≈27 pS) with or without CTZ in the bath solution. (D) Bar graph illustrating only a slight reduction of the channel conductance by CTZ.

References

    1. Antlitz, A. M. & Valle, N. G. (1967) Curr. Ther. Res. Clin. Exp. 9 288-292. - PubMed
    1. Yamada, K. A. & Tang, C. M. (1993) J. Neurosci. 13 3904-3915. - PMC - PubMed
    1. Patneau, D. K., Vyklicky, L., Jr., & Mayer, M. L. (1993) J. Neurosci. 13 3496-3509. - PMC - PubMed
    1. Trussell, L. O., Zhang, S. & Raman, I. M. (1993) Neuron 10 1185-1196. - PubMed
    1. Diamond, J. S. & Jahr, C. E. (1995) Neuron 15 1097-1107. - PubMed

Publication types

MeSH terms

LinkOut - more resources