. 2003 Nov;15(11):2514-31.
doi: 10.1105/tpc.014043. Epub 2003 Oct 10.

Proanthocyanidin-accumulating cells in Arabidopsis testa: regulation of differentiation and role in seed development

Affiliations

Proanthocyanidin-accumulating cells in Arabidopsis testa: regulation of differentiation and role in seed development

Isabelle Debeaujon et al. Plant Cell. 2003 Nov.

Abstract

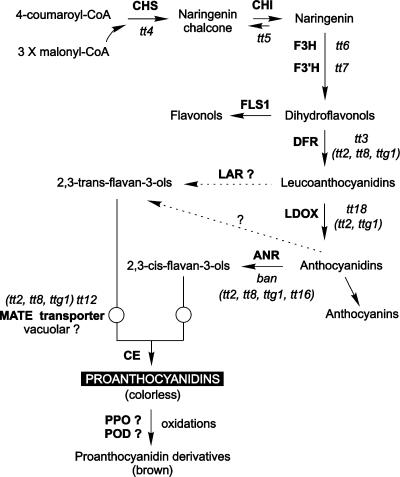
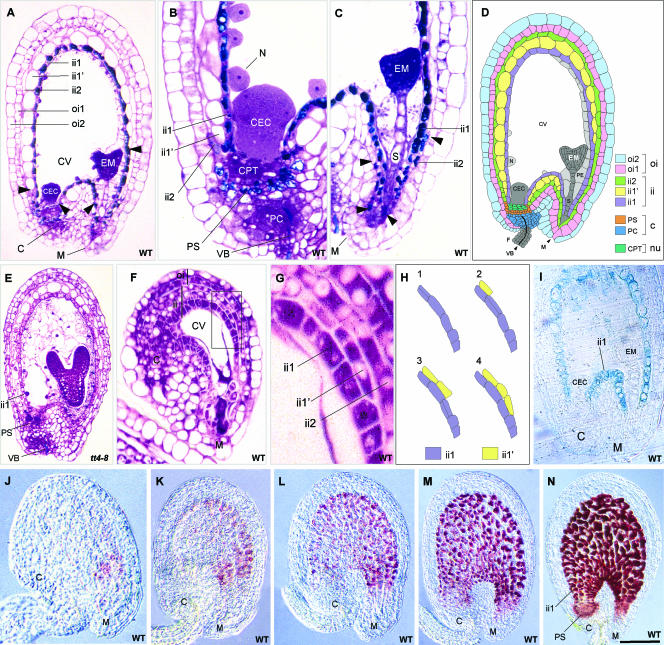
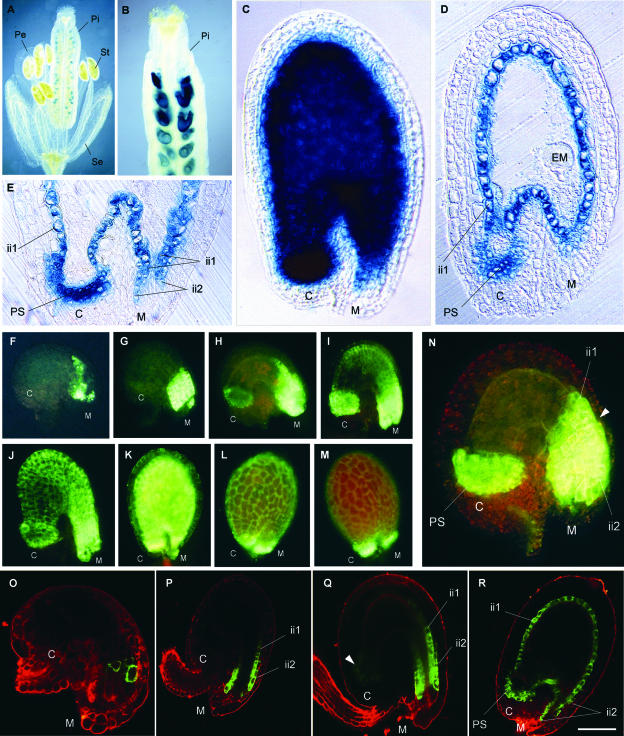
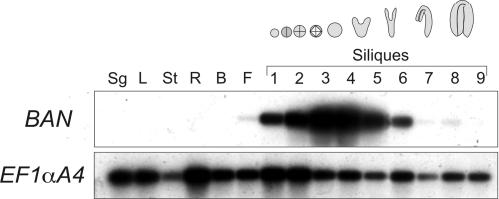
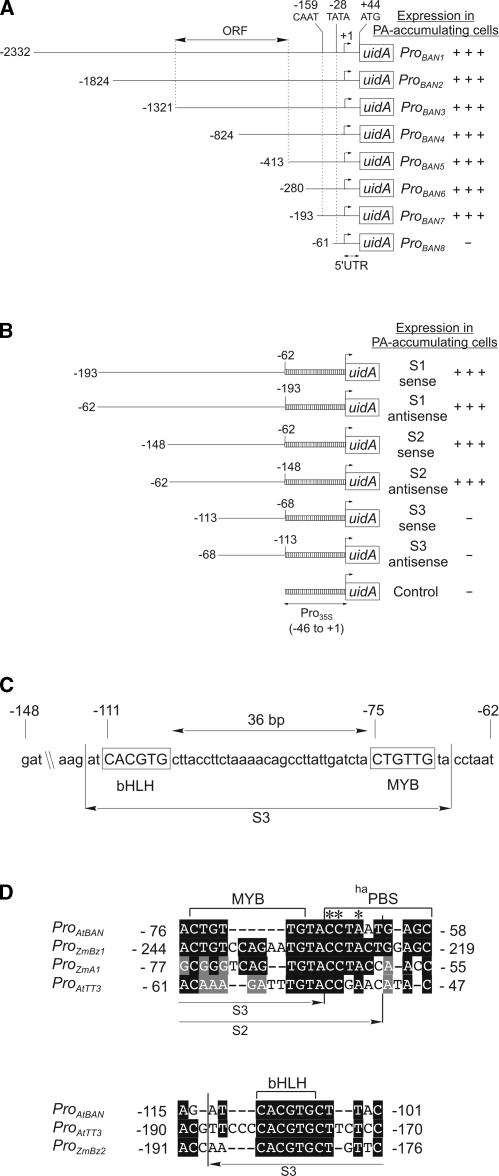
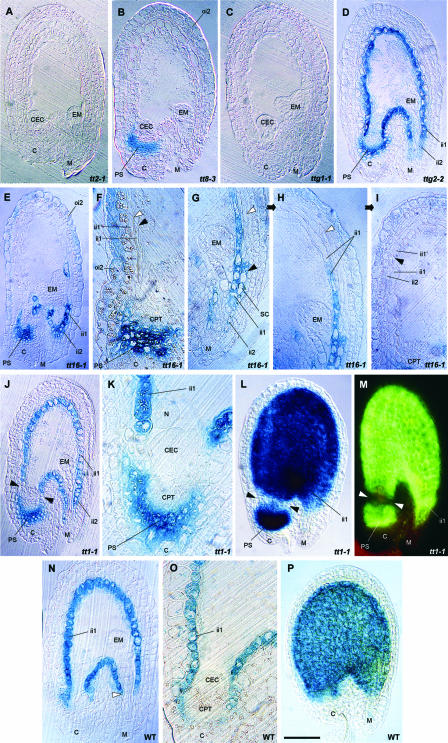
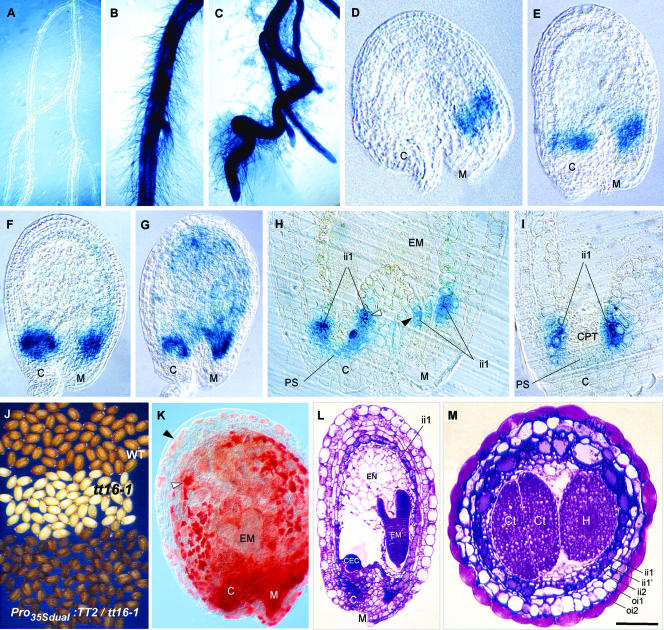
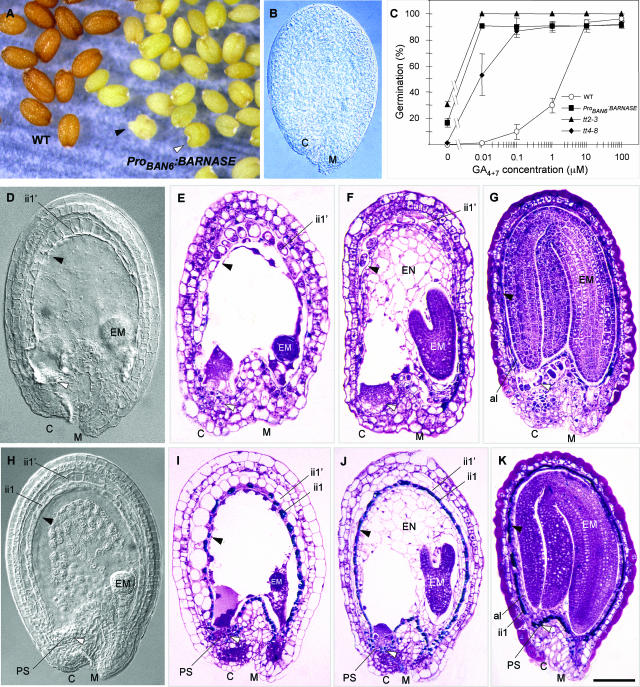
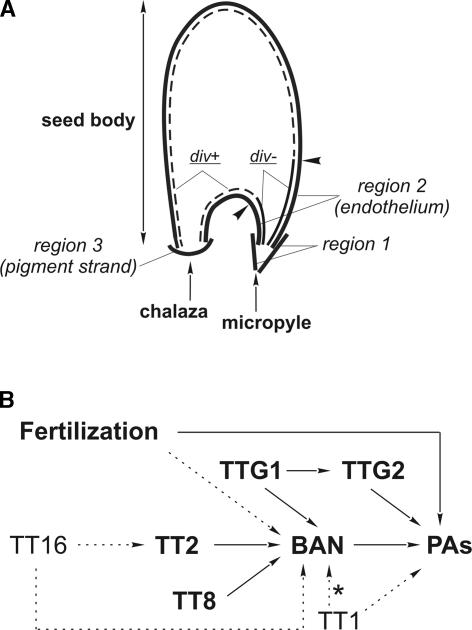
Anthocyanidin reductase encoded by the BANYULS (BAN) gene is the core enzyme in proanthocyanidin (PA) biosynthesis. Here, we analyzed the developmental mechanisms that regulate the spatiotemporal expression of BAN in the developing Arabidopsis seed coat. PA-accumulating cells were localized histochemically in the inner integument (seed body and micropyle) and pigment strand (chalaza). BAN promoter activity was detected specifically in these cells. Gain-of-function experiments showed that an 86-bp promoter fragment functioned as an enhancer specific for PA-accumulating cells. Mutations in regulatory genes of PA biosynthesis abolished BAN promoter activity (transparent testa2 [tt2], tt8, and transparent testa glabra1 [ttg1]), modified its spatial pattern (tt1 and tt16), or had no influence (ttg2), thus revealing complex regulatory interactions at several developmental levels. Genetic ablation of PA-accumulating cells targeted by the BAN promoter fused to BARNASE led to the formation of normal plants that produced viable yellow seeds. Importantly, these seeds had no obvious defects in endosperm and embryo development.


Figures

Figure 1.
Figure 1.
Scheme of the Flavonoid Biosynthetic Pathway. Enzymes are represented in uppercase boldface letters. Mutants are shown in lowercase italic letters, with regulatory mutants listed in parentheses. Dashed lines represent hypothetical steps. ANR, anthocyanidin reductase; CE, condensing enzyme; CHI, chalcone isomerase; CHS, chalcone synthase; DFR, dihydroflavonol reductase; F3H, flavonol 3-hydroxylase; F3′H, flavonol 3′-hydroxylase; FLS, flavonol synthase; LAR, leucoanthocyanidin reductase; LDOX, leucocyanidin dioxygenase; POD, peroxidase; PPO, polyphenol oxidase. Adapted from Nesi et al. (2001), Bartel and Matsuda (2003), and Xie et al. (2003).
Figure 2.
Figure 2.
Testa Structure and PA Localization in Developing Seeds. (A) to (C) Longitudinal sections of wild-type seeds at the heart stage of embryo development stained with TBO. (A) Whole seed. Arrowheads show the limits of the ii1′ layer. (B) Chalazal area. (C) Micropylar area. Arrowheads show the limits of the pigmented ii2 region. (D) Scheme of Arabidopsis seed anatomy. The integumentary layers are labeled according to Beeckman et al. (2000); the endothelium corresponds to the ii1 layer. (E) Longitudinal section of a tt4-8 seed lacking flavonoids but not lignins (TBO staining). (F) and (G) Longitudinal section of a mature wild-type ovule (TBO staining). The micropylar region in which periclinal divisions of endothelial cells took place (boxed area in [F]) is magnified in (G). (H) Scheme of periclinal division patterning in the boxed region from (F). (I) Expression pattern of the ProAtML1:uidA fusion construct in a developing seed. (J) to (N) Accumulation of PAs during seed development (whole-mount vanillin staining). Embryo stages are two cells (J), early globular (K), globular (L), early heart (M), and heart (N). C, chalaza; CEC, chalazal endosperm cyst; CPT, chalazal proliferating tissue; CV, central vacuole; EM, embryo; F, funiculus; ii, inner integument; M, micropyle; N, nodule; Nu, nucellus; oi, outer integument; PC, placentochalaza; PE, peripheral endosperm; PS, pigment strand; S, suspensor; VB, vascular bundle. Bar in (N) = 65 μm for (A), (D), and (I), 35 μm for (B) and (C), 75 μm for (E) and (M), 50 μm for (K) and (L), 100 μm for (N), 25 μm for (F) and (J), and 10 μm for (G).
Figure 3.
Figure 3.
Tissue-Specific Pattern of BAN Promoter Activity. (A) to (C) Expression of ProBAN1:uidA. GUS activity is observed on whole mounts, with Nomarski optics. (A) Flower. (B) Young silique. (C) Immature seed at the late-globular stage of embryo development. (D) and (E) Expression of ProBAN1:uidA. GUS activity is observed on sections of seeds at the globular stage, with Nomarski optics. (D) Whole seed. (E) Detailed view of the micropylar/chalazal area. (F) to (N) Expression of ProBAN1:mGFP5-ER. GFP activity is observed on whole mounts, with a standard fluorescence microscope. (F) Young unfertilized ovule. (G) Mature unfertilized ovule. (H) Young seed at the one-cell stage of embryo development. (I) Young seed at the two-cell stage. (J) Early globular stage. (K) Torpedo stage. (L) and (M) Cotyledonary stage. (N) Seven-day-old ovule obtained on a castrated flower showing ProBAN1 activity only in chalazal and micropylar areas. The arrowhead shows the limit of ProBAN activity in the ii2 layer. (O) to (R) Expression of ProBAN1:mGFP5-ER. GFP activity is observed on confocal sections. (O) Young unfertilized ovule. (P) Young seed at the two-cell stage. (Q) Seed at the early globular stage. (R) Seed at the late globular stage. C, chalaza; EM, embryo; ii, inner integument; M, micropyle; Pe, petal; Pi, pistil; PS, pigment strand; Se, sepal; St, stamen. Bar in (R) = 1 mm for (A), 250 μm for (B), 50 μm for (C), (D), (G), and (H), 35 μm for (F) and (O), 60 μm for (I) and (P), 80 μm for (J) and (R), 120 μm for (K), 150 μm for (L) and (M), 25 μm for (N), and 70 μm for (Q) and (E).
Figure 4.
Figure 4.
Pattern of BAN mRNA Accumulation. BAN mRNA was detected in various organs by semiquantitative RT-PCR after 21-cycle PCR amplification and hybridization with a BAN cDNA probe. The elongation factor EF1αA4 was used as a control. The numbers 1 to 9 indicate siliques at various stages of development; the mean embryo stage is indicated by the drawings at top. B, buds; F, flowers; L, rosette leaves; R, roots; Sg, 4-day-old seedlings; St, stems.
Figure 5.
Figure 5.
Functional Dissection of the BAN Promoter. (A) Scheme of the ProBAN:uidA 5′ deletion constructs. The transcription start was used as a reference for numbering (+1). The double-headed arrow indicates the first open reading frame (ORF) upstream of BAN. +++, presence of strong activity; −, absence of activity. UTR, untranslated region. (B) Scheme of the constructs used for gain-of-function experiments. 5′ and 3′ deletions were fused in both orientations to a minimal 35S promoter. (C) Putative MYB and bHLH binding sites detected by analysis of the S2 sequence (PA enhancer) with the SignalScan server (PLACE database) are shown. The S3 subfragment, which is inactive in gain-of-function experiments, is indicated. (D) Sequence similarity between the MYB and bHLH regions of the PA enhancer and promoters of several genes involved in PA and/or anthocyanin biosynthesis. Subfragments S2 and S3, used in gain-of-function experiments, are indicated. Numbering for ProTT3 is from the ATG. Asterisks indicate potentially crucial bases for ProBAN activation. At, Arabidopsis thaliana; haPBS, high-affinity P binding site; Zm, Zea mays.
Figure 6.
Figure 6.
Effect of Mutations in Flavonoid Regulatory Genes on BAN Promoter Activity. (A) to (L) Pattern of GUS activity driven by the ProBAN1:uidA construct in regulatory mutant backgrounds. (A) tt2-1. (B) tt8-3. (C) ttg1-1. (D) ttg2-2. (E) to (I) tt16-1. (F) Arrowheads show elongated and vacuolated ii1 (black) and ii1′ (white) cells. (G) to (I) views of the same seed section showing daughter cells from a supernumerary periclinal division in a uidA-expressing cell (black arrowhead) and supernumerary layers in the inner integument (white arrowhead) (G), supernumerary layers in the inner integument (arrowhead) (H), and atypical localization of the first ii1′ cell in the inner integument (arrowhead) (I). (J) to (L) tt1-1. (J) Arrowheads show the absence of GUS activity in a group of endothelial cells. (K) Magnification of the chalazal region in (J). (L) Whole mount showing a lack of GUS activity at the base of the endothelium (arrowheads). (M) Pattern of GFP activity driven by the ProBAN1:mGFP5-ER construct in tt1-1, confirming the lack of ProBAN activity at the base of the endothelium (arrowheads). (N) to (O) Pattern of GUS activity driven by the ProTT1:uidA construct in the wild type. (N) Section of a seed at the globular stage. (O) Detailed view of the micropylar/chalazal area. (P) Whole mount of a seed at the globular stage observed with Nomarski optics. C, chalaza; CEC, chalazal endosperm cyst; CPT, chalazal proliferating tissue; EM, embryo; ii, inner integument; M, micropyle; N, nodule; oi, outer integument; PS, pigment strand; SC, supernumerary cell. Bar in (P) = 75 μm for (A) to (E), (J), (L) to (N), and (P), 35 μm for (F) to (I) and (O), and 20 μm for (K).
Figure 7.
Figure 7.
Role of TT2 and TT16 in PA Biosynthesis. (A) to (C) Roots of 10-day-old transformants expressing ProBAN1:uidA (A), ProBAN1:uidA in a Pro35Sdual:TT2 background (B), and Pro35Sdual:uidA used as a positive control (C). (D) to (I) Pattern of TT2 promoter activity in developing seeds revealed by the detection of GUS in transformants expressing ProTT2:uidA. (D) to (G) Whole mounts were observed with Nomarski optics in a young fertilized ovule (D) and during the quadrant stage of embryo development (E), the early globular stage (F), and the globular stage (G). (H) Seed section showing a detailed view of the micropyle/chalaza area. (I) Seed section showing a detailed view of GUS activity in endothelial basal cells at the chalaza. (J) to (M) Ectopic expression of TT2 in the tt16-1 background. (J) Phenotype of mature dry seeds. (K) Vanillin assay on a developing seed at the heart stage of embryo development showing the presence of PAs in endothelial cells (white arrowhead) and ectopically in cells of the above-situated integumentary layers (black arrowhead). (L) Seed longitudinal section. (M) Seed transverse section. C, chalaza; CEC, chalazal endosperm cyst; CPT, chalazal proliferating tissue; Ct, cotyledon; EM, embryo; EN, endosperm; H, hypocotyl; ii, inner integument; M, micropyle; PS, pigment strand. Bar in (M) = 35 mm for (A), 25 mm for (B) and (C), 12 mm for (J), 80 μm for (L), 75 μm for (F) and (G), 50 μm for (E) and (M), 30 μm for (D), (H) and (I), and 65 μm for (K).
Figure 8.
Figure 8.
Genetic Ablation of PA-Accumulating Cells. (A) Phenotype of mature dry seeds. Transgenic seeds are yellow as a result of the complete ablation of PA-accumulating cells. A few seeds exhibit a tendency to vivipary (black arrowhead) or a heart shape (white arrowhead). (B) The lack of PAs in the seed coat is confirmed by a negative reaction with vanillin. (C) Germination behavior of seeds from various genotypes. Seeds were sown on 100 μM of the gibberellin biosynthesis inhibitor paclobutrazol for a complete block of wild-type seed germination. Germination was scored at 7 days after sowing. (D) to (G) Transgenic developing seeds, with arrowheads indicating missing endothelium (black) and chalazal pigment strand (white). (D) Whole mount observed with Nomarski optics. (E) to (G) Seed sections stained with TBO at the globular (E), torpedo (F), and cotyledonary (G) stages of embryo development. (H) to (K) Wild-type developing seeds, with arrowheads showing the presence of endothelium (black) and chalazal pigment strand (white). (H) Whole mount observed with Nomarski optics. (I) to (K) Seed sections stained with TBO at the globular (I), torpedo (J), and cotyledonary (K) stages of embryo development. al, aleurone layer; C, chalaza; CEC, chalazal endosperm cyst; CPT, chalazal proliferating tissue; EM, embryo; EN, endosperm; ii, inner integument; M, micropyle; oi, outer integument; PS, pigment strand. Bar in (K) = 6 mm for (A), 80 μm for (B), (G), and (K), 75 μm for (F) and (J), and 60 μm for (D), (E), (H), and (I).
Figure 9.
Figure 9.
Model for the Regulation of PA Biosynthesis in the Seed Coat. (A) Scheme showing the cadastral organization of PA-accumulating cells in three regions and their subdivisions. Arrowheads indicate the limit between endothelial cells that underwent a periclinal division (div+) and those that did not (div−). (B) Genetic regulatory pathway. Arrows indicate positive regulations. Gene activities prevailing in both the endothelium and the chalaza/micropyle are shown with boldface letters and solid arrows, and endothelium-specific activities are indicated with lightface letters and dashed arrows. The star indicates that the activity is necessary in a few cells at the endothelium base.

References

    1. Abrahams, S., Tanner, G.J., Larkin, P.J., and Ashton, A.R. (2002). Identification and biochemical characterization of mutants in the proanthocyanidin pathway in Arabidopsis. Plant Physiol. 130, 561–576. - PMC - PubMed
    1. Albert, S., Delseny, M., and Devic, M. (1997). BANYULS, a novel negative regulator of flavonoid biosynthesis in the Arabidopsis seed coat. Plant J. 11, 289–299. - PubMed
    1. Bartel, B., and Matsuda, S.P.T. (2003). Seeing red. Science 299, 352–353. - PubMed
    1. Becker, D. (1990). Binary vectors which allow the exchange of plant selectable markers and reporter genes. Nucleic Acids Res. 18, 203. - PMC - PubMed
    1. Becraft, P.W., and Asuncion-Crabb, Y. (2000). Positional cues specify and maintain aleurone cell fate in maize endosperm development. Development 127, 4039–4048. - PubMed

Publication types

MeSH terms

LinkOut - more resources