. 2003 Dec 15;553(Pt 3):857-71.
doi: 10.1113/jphysiol.2003.053447. Epub 2003 Oct 10.

Nicotine is highly effective at producing desensitization of rat alpha4beta2 neuronal nicotinic receptors

Affiliations

Nicotine is highly effective at producing desensitization of rat alpha4beta2 neuronal nicotinic receptors

K G Paradiso et al. J Physiol. .

Abstract

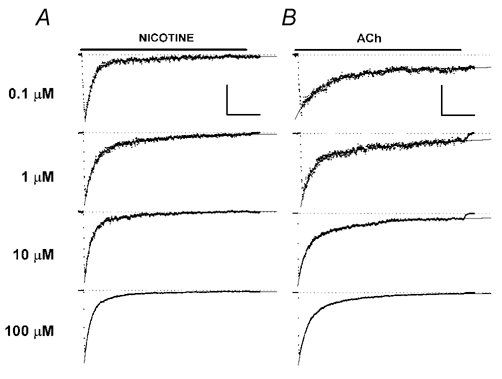
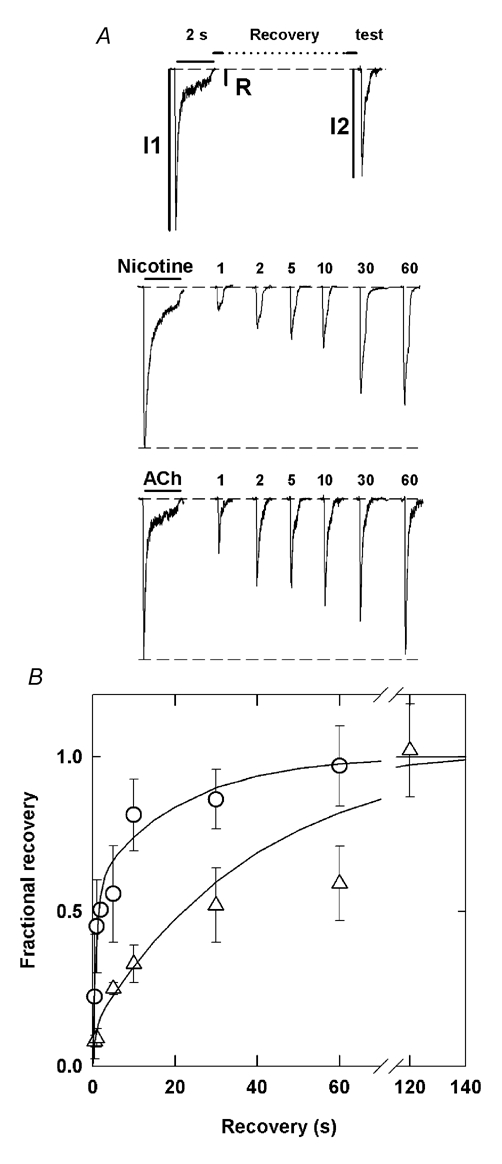
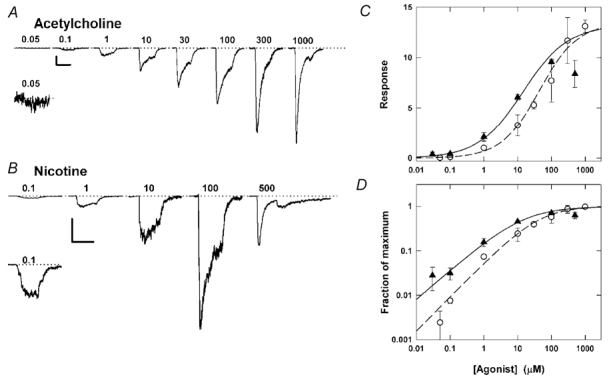
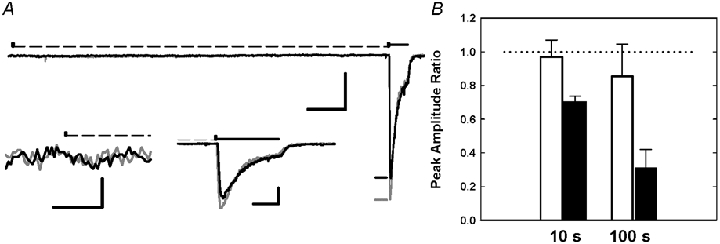
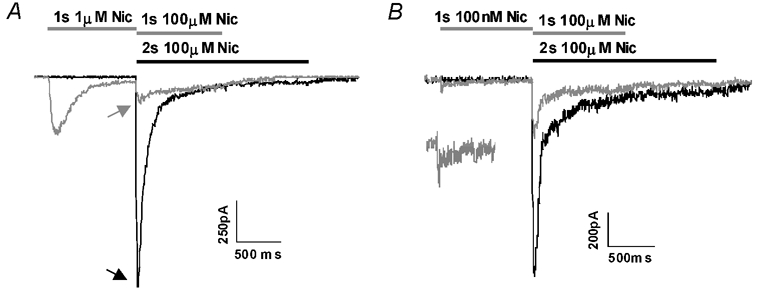
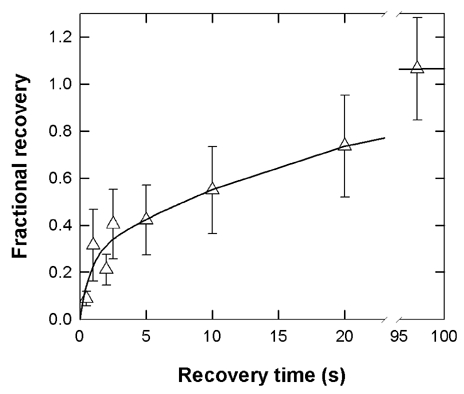
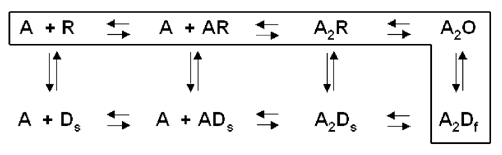
We examined desensitization by acetylcholine (ACh) and nicotine at the rat alpha4beta2 neuronal nicotinic receptor stably expressed in HEK cells. For both agonists, the decay in response due to desensitization ('onset') was best fitted by the sum of two exponentials with the fast component dominant at concentrations > 1 microM. The time constants for onset were similar for both agonists, and showed little concentration dependence over the range of 0.1-100 microM. Recovery from desensitization also showed two exponential components. In contrast to the similarity in onset, nicotine produced longer lasting desensitization, resulting from an increase in the proportion of receptors in the slowly recovering population and from an increase in the time constant for the slow recovery process. The proportion of receptors in the slowly recovering population increased as the duration of the desensitizing pulse increased. Desensitization was also induced by low concentrations of agonist, with no apparent macroscopic response. A 100 s application of 10 nM nicotine desensitized 70 % of the peak response, while 100 s of 10 nM ACh desensitized only 15 %. At higher concentrations of agonist, which result in a macroscopic response, desensitization in the absence of activation also can occur. Nicotine is a very potent and efficacious desensitizing agent at this neuronal nicotinic receptor.


Figures

Figure 2
Figure 2. The onset of desensitization
A, the left column shows responses to 0.1, 1, 10 and 100 μm nicotine (from top to bottom). In each case, the onset fit as described by the sum to two exponential components declining to a constant (see Methods), and the resulting fits are shown superimposed of the responses (thick lines through data). The fits have been extrapolated at the start and end, since the fit lines are often obscured by the data. Responses have been scaled to the same amplitude. The scale bars in the upper trace shows 1 s (all traces) and 50 pA (100 nm trace), 110 pA (1 μm), 210 pA (10 μm) and 280 pA (100 μm). B shows responses to 0.1, 1, 10 and 100 μm ACh, as for A. The vertical scale bar indicates 45 pA (100 nm trace), 120 pA (1 μm), 260 pA (10 μm) and 270 pA (100 μm). The thick horizontal bar at the top of each column indicates 5 s, while the dotted lines for each trace indicate the holding current. The applications of 100 nm agonist were 10 s in duration, and so do not show a decline to baseline. All other applications were 5 s long. Traces are from different cells. The traces were filtered at 100 Hz and decimated 5-fold for display.
Figure 4
Figure 4. Recovery from desensitization is slower for nicotine
A, the top panel illustrates the pulse protocol used. Typical recovery data are shown for data obtained with a 2 s exposure to 10 μm nicotine or 100 μm ACh. The numbers above the test responses provide the recovery interval (s). The dashed lines indicate baseline current and the maximal control response. B, the fractional recovery (see Methods) is plotted in relation to the duration of the recovery interval. The lines through the data show the predictions of the best fitting sum of two exponentials, with values: ACh τfast = 700 ms (49 %) and τslow = 17 s (51 %); nicotine τfast = 750 ms (12 %) and τslow = 40 s (88 %). The traces were obtained from multiple cells; for display the amplitudes of the responses to the 2 s conditioning pulse were normalized to the same value, and the test responses were normalized by the same factor.
Figure 1
Figure 1. Responses to ACh and nicotine
A, the response of cells to 300 ms applications of ACh at 0.05-1000 μm are shown. The inset shows the response to 50 nm ACh at a higher amplitude resolution. The traces are from a total of five cells in which the response to 1 μm ACh was similar (an average response of 165 pA). For each cell, the response to 1 μm ACh was adjusted (by < 10 %) to match the average 1 μm response, and responses at all other concentrations were scaled accordingly. B, responses, from a single cell, to 300 ms pulses of 0.1-500 μm nicotine. The inset shows the response to 100 nm nicotine at a higher amplitude resolution. Note that the response to 500 μm nicotine is reduced below that to 100 μm, and that a ‘rebound current’ appears at the end of the application. C, the relative current, normalized to the response to 1 μm ACh, is shown on a semi-logarithmic plot. The concentration–response data were fitted with the empirical Hill equation (see Methods) and provide the following estimates for the EC50, Hill coefficient and maximal response: for ACh 44 μm, 0.8 and 13.4; for nicotine 14 μm, 0.7 and 13.2. The response to 500 μm nicotine shows a decline from the response to 100 μm nicotine and was not included in the fitted concentration response data. D, the concentration–response data for nicotine and ACh graphed on a double logarithmic plot, normalized to the fit maximal response to better illustrate the slope of the concentration–response relationship and the fraction of receptors activated at each concentration. (Triangles: nicotine, circles: ACh. Data are means ±s.d. for 3–22 cells, except for response to 1 mm ACh which is the mean for 2 cells.)
Figure 3
Figure 3. The onset of desensitization shows little dependence on agonist concentration or fractional activation
A, the fast and slow time constants for the onset of desensitization are shown as a function of agonist concentration. There is little change in the time constants over this 1000-fold range of concentration. B, time constants are plotted as a function of fractional activation. C, the mean value for the fit constant term (open symbols; see Methods) and the residual current at 5 s (filled symbols) are plotted as a function of agonist concentration. There is a decline in the estimated steady-state response with increasing concentration. D, the ratio of the fit amplitude for the fast component to that for the slow component is shown as a function of agonist concentration. The relative amount of the rapidly decaying component increases with agonist concentration. The dashed lines in A and B show a slope of −1. (Triangles: nicotine, circles: ACh. Data are means ±s.d. for 4–21 cells.)
Figure 5
Figure 5. Prolonged duration of desensitization promotes entry into a slowly recovering state
A two-pulse protocol was used in which the desensitizing pulse duration was variable and the drug free wash was fixed at 5 s (see Methods). A, traces show the decrease in recovery as the duration of the desensitizing pulse increases. Typical responses to 10 s agonist applications are shown, with the tick marks showing durations of 0.5, 1, 2, 5 and 10 s. The numbers above the test responses provide the duration of the desensitizing pulse. B, the fractional recovery is plotted in relation to the duration of the desensitizing pulse duration. The lines through the data show the predictions of the best fitting sum of two exponentials declining to a constant, with values: ACh τfast = 300 ms (30 %) and τslow = 6 s (56 %) and 13 % residual response; nicotine τfast = 200 ms (78 %) and τslow = 8 s (19 %) and 3 % residual response. As in Fig. 4, receptors were desensitized by 10 μm nicotine or 100 μm ACh. Cells were held at −100 mV during the agonist application and −50 mV during the 5 s wash. The data were obtained from multiple cells; for display the amplitudes of the responses to the conditioning pulse were normalized to the same value, and the test responses were normalized by the same factor.
Figure 6
Figure 6. Application of a subactivating concentration of ACh or nicotine can desensitize receptors
A, representative set of current traces indicating desensitization induced by a 10 s pulse of 10 nm nicotine (scale bars 100 pA and 1 s). There are 2 traces superimposed; the dark trace shows the response obtained when the 10 s pulse contained 10 nm nicotine, while the lighter trace shows the response obtained about 2 min later when the 10 s pulse was bath saline. Both traces show the response to a test pulse 100 μm ACh, applied immediately after the end of the 10 s pre-pulse. The timing of the 10 s prepulse is indicated by the dashed line above the trace, while the test pulse is indicated by the heavy line. The short horizontal lines just before the responses to 100 μm ACh indicate the peak values for the responses. The inset traces show time expanded views of the start of the 10 s applications (left; scale bars 6 pA and 100 ms) and the responses to 100 μm ACh (right; scale bars 100 pA and 200 ms). B, 10 nm ACh or nicotine was applied for 10 or 100 s followed by a test pulse of 100 μm ACh. Desensitization was measured as the ratio of the peak amplitude of the test pulse following exposure to 10 nm agonist compared to the average peak amplitude of a 100 μm ACh control response ≈100 s before and ≈120 s after the test pulse. The bars show desensitization after pre-exposure to ACh (open) or nicotine (black) (mean ±s.d.).
Figure 7
Figure 7. Nicotine at 100 nm produces less activation but similar levels of desensitization compared to 1 μm nicotine
A, activation and desensitization were produced by a 1 s application of 1 μm nicotine, then a test pulse of 100 μm nicotine was immediately applied to assess desensitization. Two traces are superimposed: the lighter trace shows the response to a 1 s application of 1 μm nicotine followed immediately by a 1 s application of 100 μm nicotine. The darker trace shows the response to a 2 s application of nicotine (without a pre-pulse), obtained ≈2 min before the lighter trace. The two traces are aligned at the start of the application of 100 μm nicotine, to indicate the amount of desensitization (peak responses indicated by arrows). Activation was estimated from the charge transfer during the response to the initial 1 s application, normalized to the responses to 100 μm nicotine, while desensitization was measured by the relative responses to 100 μm nicotine with and without the 1 s conditioning pulse (see Methods). B, the same protocol was applied, using 100 nm rather than 1 μm nicotine in the 1 s pre-pulse.
Figure 8
Figure 8. Slow recovery following a prolonged exposure to a low concentration of nicotine
Recovery from desensitization produced by a 10 s exposure to 100 nm nicotine is shown. The fractional recovery occurred along a time course showing two exponentials, with best fitting values of: τfast = 780 ms (25 % or recovery) and τslow = 22.3 s (75 % of recovery). Data show means ±s.d. for 4–13 points, except for recoveries at 0.5 and 2 s which are data from 2 cells each.
Figure 9
Figure 9. A cyclic kinetic scheme for desensitization
The cyclic scheme proposed by Cachelin & Colquhoun (1988) for the muscle receptor is shown. A resting receptor is shown by R, a receptor with an open channel by O, an agonist molecule by A, the rapidly recovering desensitized state by Df and the slowly recovering state by Ds. In the case of the muscle nicotinic receptor, equilibration between A2O and A2Df is more rapid than between R and Ds and the agonist binding and unbinding steps are much more rapid than any transitions to or from desensitized states. The box encloses the pathway for the initial onset of desensitization at relatively high concentrations of agonist, for the muscle receptor.

Similar articles

Cited by

References

    1. Auerbach A, Akk G. Desensitization of mouse nicotinic acetylcholine receptor channels. A two-gate mechanism. J Gen Physiol. 1998;112:181–197. - PMC - PubMed
    1. Benwell MEM, Balfour DJK, Anderson JM. Evidence that tobacco smoking increases the density of (−)-[3H]nicotine binding sites in human brain. J Neurochem. 1988;50:1243–1247. - PubMed
    1. Boyd ND. Two distinct kinetic phases of desensitization of acetylcholine receptors of clonal rat PC12 cells. J Physiol. 1987;389:45–67. - PMC - PubMed
    1. Bufler J, Franke C, Witzemann V, Ruppersberg JP, Merlitze S, Dudel J. Desensitization of embryonic nicotinic acetylcholine receptors expressed in Xenopus oocytes. Neurosci Lett. 1993;152:77–80. - PubMed
    1. Buisson B, Bertrand D. Chronic exposure to nicotine upregulates the human (alpha)4(beta) nicotinic acytylcholine receptor function. J Neurosci. 2001;21:1819–1829. - PMC - PubMed

Publication types

LinkOut - more resources