Comparative Study
. 2004 Jan 15;554(Pt 2):483-95.
doi: 10.1113/jphysiol.2003.048777. Epub 2003 Oct 10.

Shaping the excitability of human motor cortex with premotor rTMS

Affiliations
Comparative Study

Shaping the excitability of human motor cortex with premotor rTMS

Vincenzo Rizzo et al. J Physiol. .

Abstract

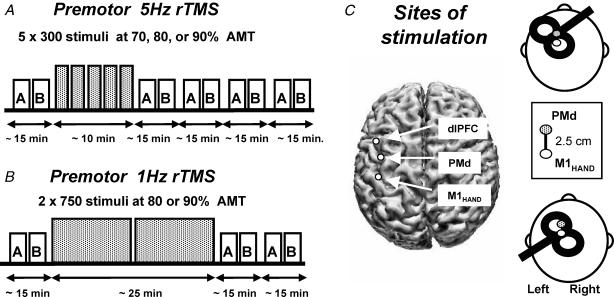
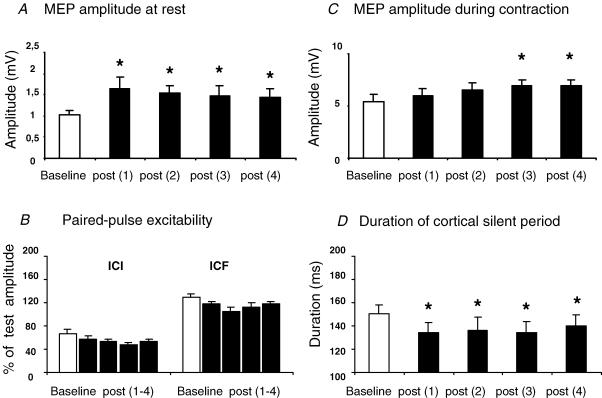
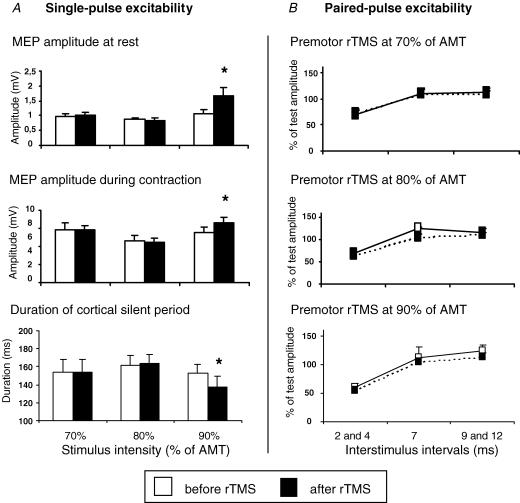
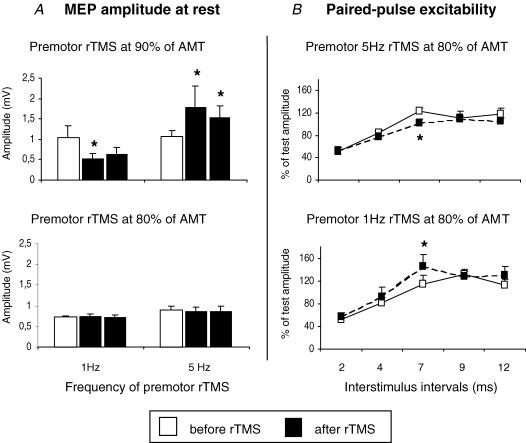
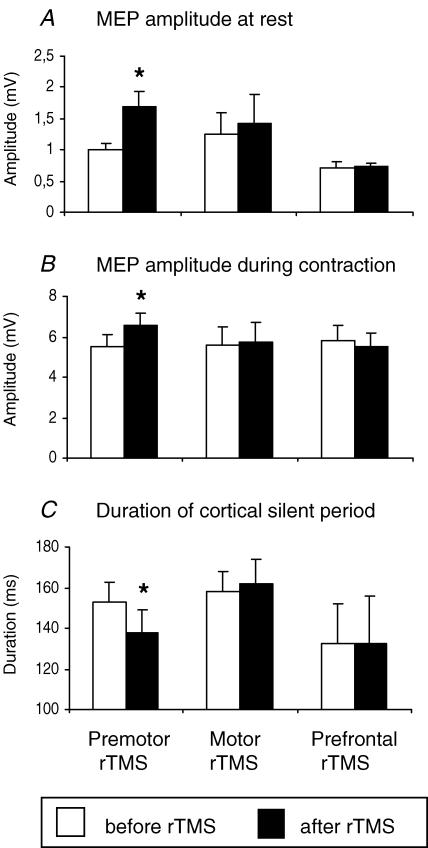
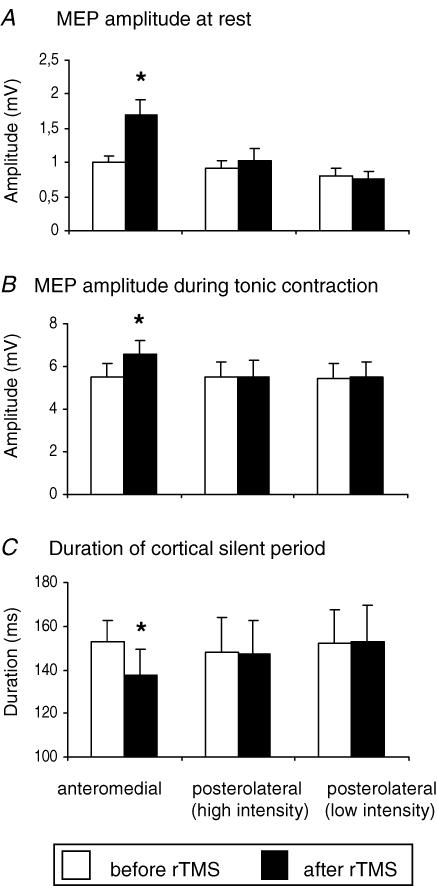
Recent studies have shown that low-frequency repetitive transcranial magnetic stimulation (rTMS) to the left dorsal premotor cortex has a lasting influence on the excitability of specific neuronal subpopulations in the ipsilateral primary motor hand area (M1(HAND)). Here we asked how these premotor to motor interactions are shaped by the intensity and frequency of rTMS and the orientation of the stimulating coil. We confirmed that premotor rTMS at 1 Hz and an intensity of 90% active motor threshold (AMT) produced a lasting decrease in corticospinal excitability probed with single-pulse TMS over the left M1(HAND). Reducing the intensity to 80% AMT increased paired-pulse excitability at an interstimulus interval (ISI) of 7 ms. Opposite effects occurred if rTMS was given at 5 Hz: at 90% AMT, corticospinal excitability increased; at 80% AMT, paired-pulse excitability at ISI = 7 ms decreased. No effects were seen if rTMS was applied at the same intensities to prefrontal or primary motor cortices. These findings indicate that the intensity of premotor rTMS determines the net effect of conditioning on distinct populations of neurones in the ipsilateral M1(HAND), but it is the frequency of rTMS that determines the direction of the induced change. By selecting the appropriate intensity and frequency, premotor rTMS allows to induce a predictable up- or down-regulation of the excitability in distinct neuronal circuits of human M1(HAND).


Figures

Figure 1
Figure 1. Experimental design
5 Hz rTMS (A) was given in five blocks of 300 stimuli, each separated by 1 min. MEP amplitude and SICI/ICF at rest (box A) and MEP amplitude during contraction and the duration of the cortical silent period (CSP) (box B) were determined before and four times afterwards in an alternating order. Stimulus intensity of rTMS is expressed as a percentage of the active motor threshold (AMT) for the ipsilateral M1HAND. 1Hz rTMS consisted of two sets of 750 stimuli with an intertrain interval of 1 min (B). In contrast to the experiments using 5Hz rTMS, only two measurements of motor cortex excitability were carried out after the end of the rTMS session. C, coil position and orientation for rTMS of the left dorsal premotor cortex (top left) and single-/paired-pulse TMS of the left primary motor hand area (M1HAND) (bottom left). The site for stimulation of the M1HAND was defined as being 2.5 cm rostral to the ‘motor hot spot’ for the FDI muscle (see Methods). A three-dimensional reconstruction of an individual brain shows the sites for stimulation of the premotor cortex, M1HAND, and the dorsolateral prefrontal cortex (dLPFC) projected onto the surface of the cortex.
Figure 2
Figure 2. Conditioning effects of premotor 5Hz rTMS at 90% AMT on MEP amplitude (A and C), the duration of the cortical silent period (D), and paired-pulse excitability (B)
Intracortical inhibition (SICI) was assessed using interstimulus-intervals (ISIs) of 2 and 4 ms (B, left). Intracortical facilitation (ICF) was estimated using ISIs of 9 and 12 ms (B, right). Error bars are standard error of the mean (s.e.m.). Asterisks denote a significant change relative to baseline.
Figure 3
Figure 3. Intensity-dependent conditioning effects of premotor 5Hz rTMS on the excitability in ipsilateral M1HAND
A, effects on single-pulse excitability of ipsilateral M1HAND The MEP amplitude at rest (top) and during tonic contraction (middle) and on the duration of the cortical silent period (bottom). B, the after effects on paired-pulse excitability are separately illustrated for intracortical inhibition at ISIs of 2 and 4 ms, intracortical facilitation at ISIs of 9 and 12 ms, and an intermediate interval of 7 ms. Error bars are standard error of the mean (s.e.m.). Asterisks denote a significant change relative to baseline.
Figure 4
Figure 4. Interaction between frequency and intensity of premotor rTMS on conditioning effects in the left M1HAND
A, conditioning effects on corticospinal excitability as indexed by the MEP amplitude at rest. The columns indicate mean MEP amplitudes before (white) and after premotor rTMS (black). B, conditioning effects of premotor rTMS at 80% of AMT on paired-pulse excitability at an ISI of 7 ms. Error bars are standard error of the mean (s.e.m.). Asterisks denote a significant change relative to baseline.
Figure 5
Figure 5. Comparison of the effect of giving 5 Hz rTMS at 90% AMT over premotor (PMd, left pair of columns), motor (M1HAND, middle pairs of columns) and prefrontal (dLPFC, right pairs of columns) cortical sites
A, mean MEP amplitudes at rest. B, mean MEP amplitudes during tonic contraction. C, duration of the cortical silent period. Error bars are standard error of the mean (s.e.m.). Asterisks denote a significant change relative to baseline.
Figure 6
Figure 6. Effect of coil orientation during premotor rTMS on changes in MEP amplitude of the relaxed (A) or active (B) hand muscle and on the duration of the cortical silent period (C)
Error bars are standard error of the mean (s.e.m.). Asterisks denote a significant change relative to baseline. Posterolateral (low intensity) refers to stimulation with the handle of the TMS coil pointing posterolaterally, at an intensity equal to 90% AMT assessed with the handle pointing anteromedially (as in the main experiment) (mean of 38% maximum stimulator output). High intensity posterolateral stimulation refers to stimulation at 90% AMT as assessed with a posterolateral coil orientation (mean of 45% maximum stimulator output).

References

    1. Brasil-Neto JP, Cohen LG, Panizza M, Nilsson J, Roth BJ, Hallett M. Optimal focal transcranial magnetic activation of the human motor cortex: effects of coil orientation, shape of the induced current pulse, and stimulus intensity. J Clin Neurophysiol. 1992;9:132–136. - PubMed
    1. Cerri G, Shimazu H, Maier MA, Lemon RN. Facilitation from ventral premotor cortex of primary motor cortex outputs to macaque hand muscles. J Neurophysiol. 2003;90:832–842. - PubMed
    1. Chen R, Classen J, Gerloff C, Celnik P, Wassermann EM, Hallett M, Cohen LG. Depression of motor cortex excitability by low-frequency transcranial magnetic stimulation. Neurology. 1997;48:1398–1403. - PubMed
    1. Chen R, Lozano AM, Ashby P. Mechanism of the silent period following transcranial magnetic stimulation. Evidence from epidural recordings. Exp Br Res. 1999;128:539–542. - PubMed
    1. DiLazzaro V, Restuccia D, Oliviero A, Profice P, Ferrara L, Insola A, Mazzone P, Tonali P, Rothwell JC. Magnetic transcranial stimulation at intensities below active motor threshold activates intracortical inhibitory circuits. Exp Brain Res. 1998;119:265–268. - PubMed

Publication types