Comparative Study
. 2003 Nov;122(5):511-9.
doi: 10.1085/jgp.200308866. Epub 2003 Oct 13.

Sodium and chloride concentrations, pH, and depth of airway surface liquid in distal airways

Affiliations
Comparative Study

Sodium and chloride concentrations, pH, and depth of airway surface liquid in distal airways

Yuanlin Song et al. J Gen Physiol. 2003 Nov.

Abstract

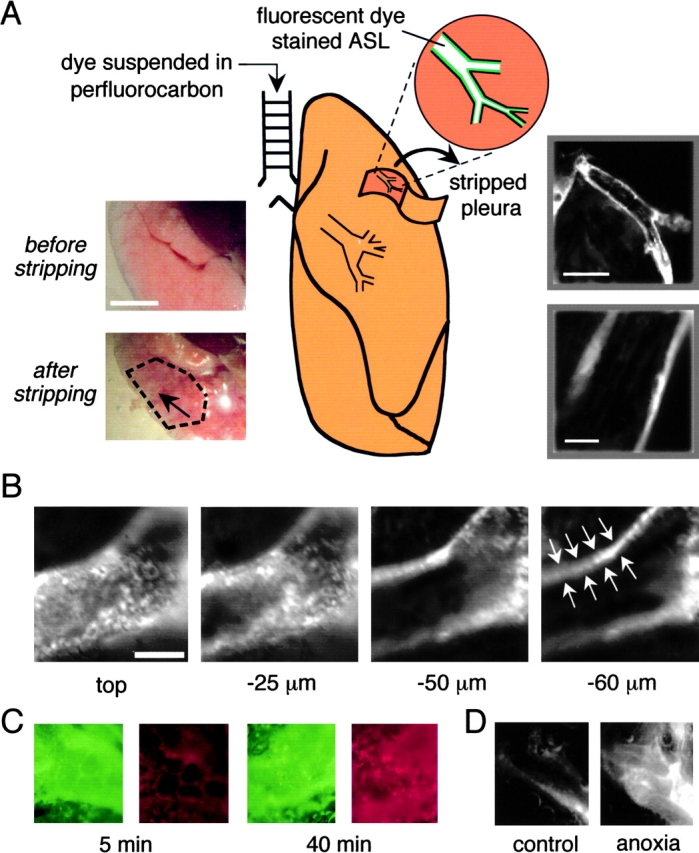
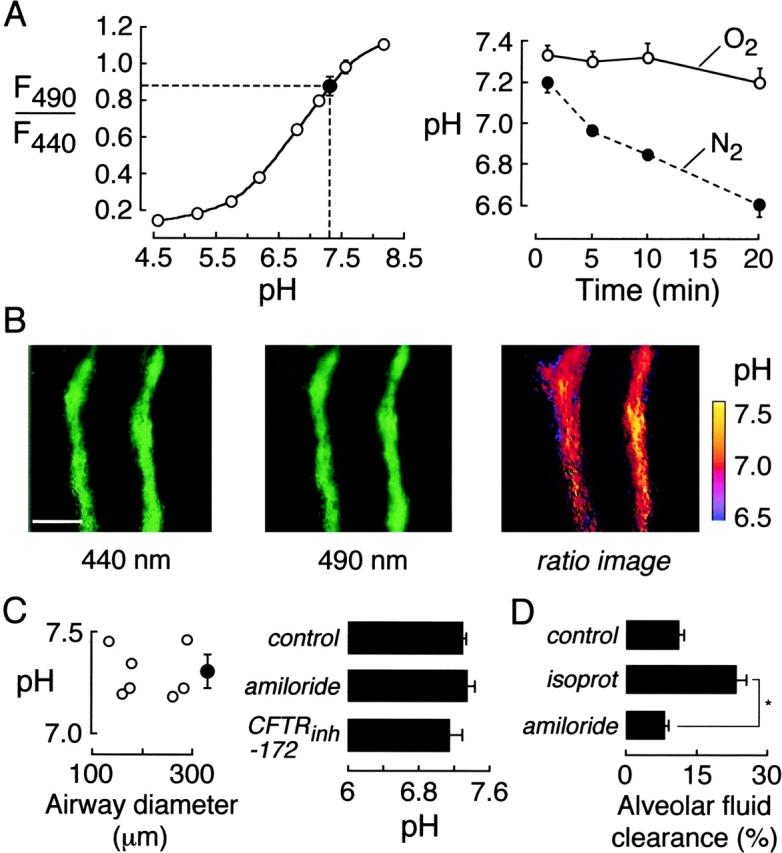
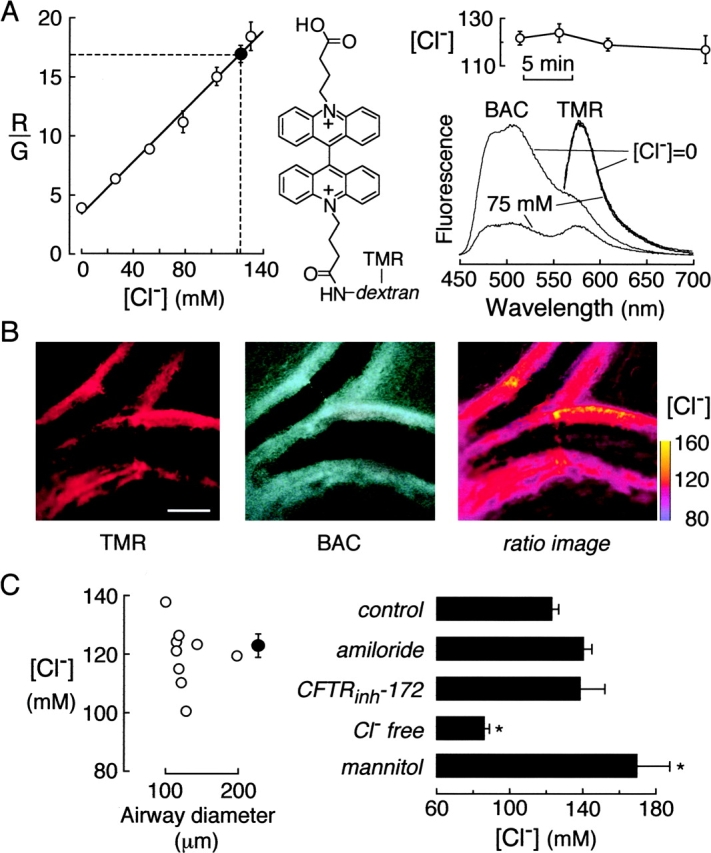
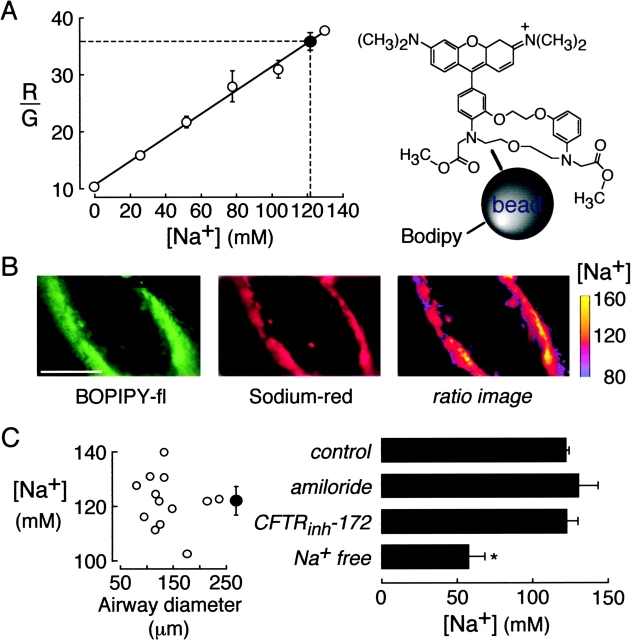
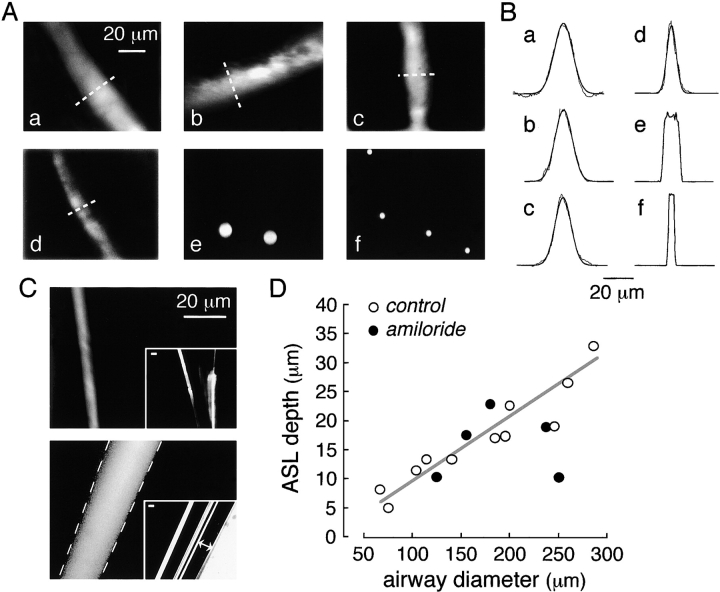
The composition and depth of the airway surface liquid (ASL) are key parameters in airway physiology that are thought to be important in the pathophysiology of cystic fibrosis and other diseases of the airways. We reported novel fluorescent indicator and microscopy methods to measure [Na+], [Cl-], pH, and depth of the ASL in large airways (Jayaraman, S., Y. Song, L. Vetrivel, L. Shankar, and A.S. Verkman. 2001. J. Clin. Invest. 107:317-324.). Here we report a stripped-lung preparation to measure ASL composition and depth in small distal airways. Distal ASL was stained with ion- or pH-sensitive fluorescent indicators by infusion into mouse trachea of a perfluorocarbon suspension of the indicator. After stripping the pleura and limited microdissection of the lung parenchyma, airways were exposed for measurement of ASL [Na+], [Cl-], and pH by ratio imaging microscopy, and depth by confocal microscopy. The stripped-lung preparation was validated in stability and tissue viability studies. ASL [Na+] was 122 +/- 2 mM, [Cl-] was 123 +/- 4 mM and pH was 7.28 +/- 0.07, and not dependent on airway size (<100- to >250-mum diameter), ENaC inhibition by amiloride, or CFTR inhibition by the thiazolidinone CFTRinh-172. ASL depth was 8-35 mum depending on airway size, substantially less than that in mouse trachea of approximately 55 mum, and not altered significantly by amiloride. These results establish a novel lung preparation and fluorescence approach to study distal airway physiology and provide the first data on the composition and depth of distal ASL.


Figures

F<sc>igure</sc> 1.
Figure 1.
Stripped-lung preparation for visualization of fluorescently stained distal airway surface liquid. (A) Schematic of method for ASL staining and exposure of small airways. As described in materials and methods, fluorescent dye in a perfluorocarbon suspension was instilled into the trachea, and small airways were exposed by pleural stripping and limited parenchymal microdissection. (Left inset) Brightfield low magnification images of airway preparation before and after (region bounded by black dashes) pleural stripping. Black arrow points to a visible airway. Bar, 5 mm. (Right inset) Low and high magnification wide-field fluorescence micrographs after ASL staining with TMR-dextran. Bars: 500 μm (top) and 100 μm (bottom). (B) Confocal fluorescence images taken at indicated depths into a distal airway. White arrows point to fluorescently-stained ASL. Bar, 50 μm. (C) Viability of airway epithelia studied using a live/dead stain (green for live cells and red for dead cells). Fluorescence micrographs taken at 5 min (left) and 40 min (right). (D) Images as in B, taken after distal ASL staining with the small polar dye sulforhodamine 101 before (left) and at 10 min after anoxia (right).
F<sc>igure</sc> 2.
Figure 2.
ASL pH in mouse distal airways. The ASL was stained with BCECF-dextran. (A, left) Ratio of BCECF-dextran green fluorescence measured at 490- and 440-nm excitation wavelengths (F490/F440) as a function of pH in in vitro measurements (open circles). Also shown is averaged F490/F440 and deduced pH in ASL of distal airways (filled circle). (Right) Time course of ASL pH in distal airways exposed to O2 (humidified, with 5% CO2) versus N2 at 37°C. (B) Fluorescence images of BCECF-dextran-stained distal airway taken at 440 nm (left) and 490 nm (middle) excitation wavelengths. Spatial map of ASL pH shown as pseudocolored ratio image (right). Bar, 100 μm. (C) ASL pH measured in airways of indicated size (left) and after administration of inhibitors (right) (mean ± SE, n = 8–12 airways). (D) Alveolar fluid clearance (percentage absorption at 30 min) in lungs at 37°C after tracheal fluid instillation of PBS (“control”) or isoproterenol (“isoprot”, 100 μM). Where indicated (“amiloride”), mice were given amiloride (10 mg/kg i.p.) 45 min before measurement (isoproterenol present in the instillate). *P < 0.001.
F<sc>igure</sc> 3.
Figure 3.
[Cl] in ASL of mouse distal airways. The ASL was stained with BAC-TMR-dextran, containing green-fluorescing Cl-sensitive BAC and red-fluorescing Cl-insensitive TMR chromophores. (A, left) Ratio of red-to-green fluorescence (R/G) of as a function of [Cl] in vitro. Measurements done in PBS in which Cl was replaced by NO3 (open circles). Also shown in averaged R/G and deduced [Cl] in ASL of distal airways (filled circle). (Middle) Chemical structure of BAC-TMR-dextran. (Right, top) Time course of ASL [Cl] in distal airways. (Right, bottom) Fluorescence emission spectra of BAC-TMR-dextran in PBS containing 0 or 75 mM Cl (NO3 replacing Cl). (B) Red (left) and green (middle) images of BAC-TMR-dextran–stained distal airways. Spatial map of ASL [Cl] shown as pseudocolored ratio image (right). Bar, 100 μm. (C) ASL [Cl] measured in airways of indicated size (left) and after indicated maneuvers (right). Maneuvers include ENaC and CFTR inhibition, pulmonary artery perfusion with 0 Cl buffer for 45 min before measurements (“Cl free”), and hypertonic solution (“mannitol”) where perfusion was done for 45 min with PBS + 300 mM mannitol.
F<sc>igure</sc> 4.
Figure 4.
[Na+] in ASL of mouse distal airways. The ASL was stained with 200-nm diameter polystyrene beads containing Na+-sensitive Corona redTM (red fluorescing) and Na+-insensitive BODIPY-fl (green fluorescing). (A) Ratio of red-to-green fluorescence (R/G) of the Na+ indicator as a function of [Na+] in PBS in which Na+ was replaced by choline+ (open circles). Also shown in averaged R/G and deduced [Na+] in ASL of distal airways (filled circle). (B) Green (left) and red (middle) images of fluorescently-stained distal airways. Spatial map of ASL [Na+] shown as pseudocolored ratio image (right). Bar, 100 μm. (C). ASL [Na+] measured in airways of indicated size (left) and after indicated maneuvers (right). Maneuvers include ENaC and CFTR inhibition, and pulmonary artery perfusion with 0 Na+ buffer for 45 min before measurements (“Na+ free”).
F<sc>igure</sc> 5.
Figure 5.
ASL depth in mouse distal airways. (A) Representative fluorescence confocal images of TMR-dextran–stained ASL in distal airways of different diameters. Stained ASL (only one edge of airway) shown at high magnification. Airway diameters were 260, 200, 185, and 105 μm for a–d, respectively. Confocal images of red fluorescent latex beads of 9.7 and 3.7 μm diameter shown in e and f. (B) Fluorescence scans taken at indicated regions of ASL from images in a–d in A (dashed lines) along with fitted Gaussian functions (smooth curves). Scans taken through center of beads for e and f. (C, top) Fluorescence confocal image of glass micropipette coated with a submicron fluorescent layer (by dipping in chloroform containing dissolved green-fluorescing polystyrene beads). Inset shows low magnification wide-field fluorescence. (Bottom) Fluorescence confocal image taken at the center of concentric glass micropipettes sandwiching an annular fluorescent aqueous layer (TMR-dextran in water). Dashed lines show boundary of inner and outer micropipettes determined from brightfield micrographs as shown in the inset (lines with double arrows). Bars, 20 μm. (D) ASL depth as a function of airway diameter determined by reconvolution of scans as in B (open circles, control mice; closed circles, amiloride-treated mice). Differences in control versus amiloride-treated mice not significant.

References

    1. Al-Bazzaz, F.J. 1994. Regulation of Na and Cl transport in sheep distal airways. Am. J. Physiol. 267:L193–L198. - PubMed
    1. Blouquit, S., H. Morel, J. Hinnrasky, E. Naline, E. Puchelle, and T. Chinet. 2002. Characterization of ion and fluid transport in human bronchioles. Am. J. Respir. Cell Mol. Biol. 27:503–510. - PubMed
    1. Boucher, R.C. 1999. Molecular insights into the physiology of the ‘thin film’ of airway surface liquid. J. Physiol. 516:631–638. - PMC - PubMed
    1. Edmonds, R.D., I.V. Silva, W.B. Guggino, R.B. Butler, P.L. Zeitlin, and C.J. Blaisdell. 2002. ClC-5: ontogeny of an alternative chloride channel in respiratory epithelia. Am. J. Physiol. 282:L501–L507. - PubMed
    1. Fang, X., N. Fukuda, P. Barbry, C. Sartori, A.S. Verkman, and M.A. Matthay. 2002. Novel role for CFTR in fluid absorption from the distal airspaces of the lung. J. Gen. Physiol. 119:199–207. - PMC - PubMed

Publication types