

Elevated gene expression levels distinguish human from non-human primate brains
- PMID: 14557539
- PMCID: PMC240739
- DOI: 10.1073/pnas.2135499100
Elevated gene expression levels distinguish human from non-human primate brains
Abstract
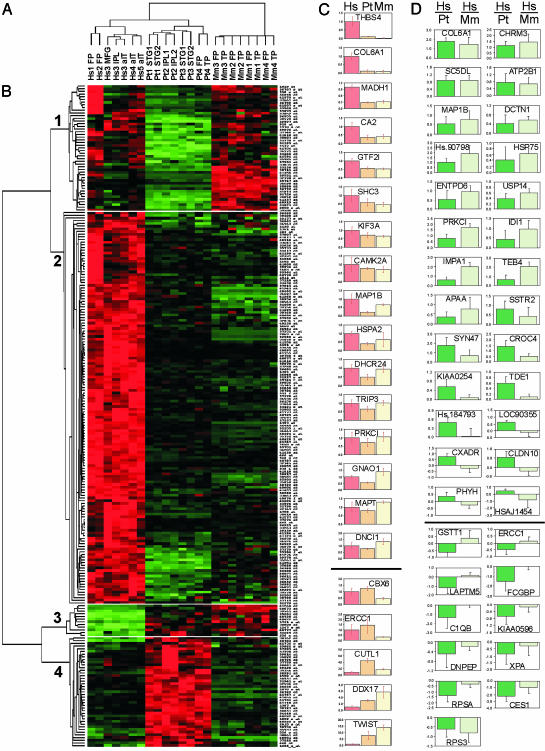
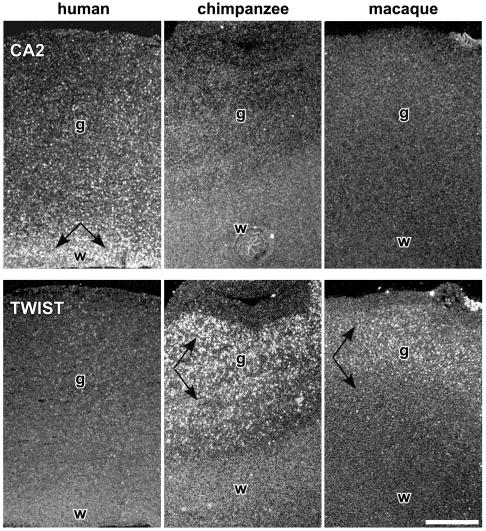
Little is known about how the human brain differs from that of our closest relatives. To investigate the genetic basis of human specializations in brain organization and cognition, we compared gene expression profiles for the cerebral cortex of humans, chimpanzees, and rhesus macaques by using several independent techniques. We identified 169 genes that exhibited expression differences between human and chimpanzee cortex, and 91 were ascribed to the human lineage by using macaques as an outgroup. Surprisingly, most differences between the brains of humans and non-human primates involved up-regulation, with approximately 90% of the genes being more highly expressed in humans. By contrast, in the comparison of human and chimpanzee heart and liver, the numbers of up- and down-regulated genes were nearly identical. Our results indicate that the human brain displays a distinctive pattern of gene expression relative to non-human primates, with higher expression levels for many genes belonging to a wide variety of functional classes. The increased expression of these genes could provide the basis for extensive modifications of cerebral physiology and function in humans and suggests that the human brain is characterized by elevated levels of neuronal activity.
Figures
References
-
- Tomasello, M. & Call, J. (1997) Primate Cognition (Oxford Univ. Press, New York).
-
- Povinelli, D. J. (2000) Folk Physics for Apes (Oxford Univ. Press, Oxford).
-
- Jerison, H. J. (1973) Evolution of the Brain and Intelligence (Academic, New York).
-
- Stephan, H., Baron, G. & Frahm, H. D. (1988) in Comparative Primate Biology, eds. Steklis, H. D. & Erwin, J. (Liss, New York), Vol. 4, 1-38.
Publication types
MeSH terms
Substances
Associated data
- Actions
- Actions
- Actions
- Actions
- Actions
- Actions
- Actions
- Actions
- Actions
- Actions
- Actions
- Actions
- Actions
- Actions
- Actions
- Actions
- Actions
- Actions
- Actions
- Actions
- Actions
- Actions
- Actions
- Actions
- Actions
- Actions
- Actions
- Actions
- Actions
- Actions
- Actions
- Actions
- Actions
- Actions
- Actions
- Actions
- Actions
- Actions
- Actions
- Actions
- Actions
- Actions
- Actions
- Actions
- Actions
- Actions
- Actions
- Actions
- Actions
- Actions
- Actions
- Actions
- Actions
- Actions
- Actions
- Actions
- Actions
- Actions
- Actions
- Actions
- Actions
- Actions
- Actions
- Actions
- Actions
- Actions
- Actions
- Actions
- Actions
- Actions
- Actions
- Actions
LinkOut - more resources
Full Text Sources
Other Literature Sources
Molecular Biology Databases
