. 2003 Nov;77(21):11398-407.
doi: 10.1128/jvi.77.21.11398-11407.2003.

The human immunodeficiency virus type 1 Vif protein reduces intracellular expression and inhibits packaging of APOBEC3G (CEM15), a cellular inhibitor of virus infectivity

Affiliations

The human immunodeficiency virus type 1 Vif protein reduces intracellular expression and inhibits packaging of APOBEC3G (CEM15), a cellular inhibitor of virus infectivity

Sandra Kao et al. J Virol. 2003 Nov.

Abstract

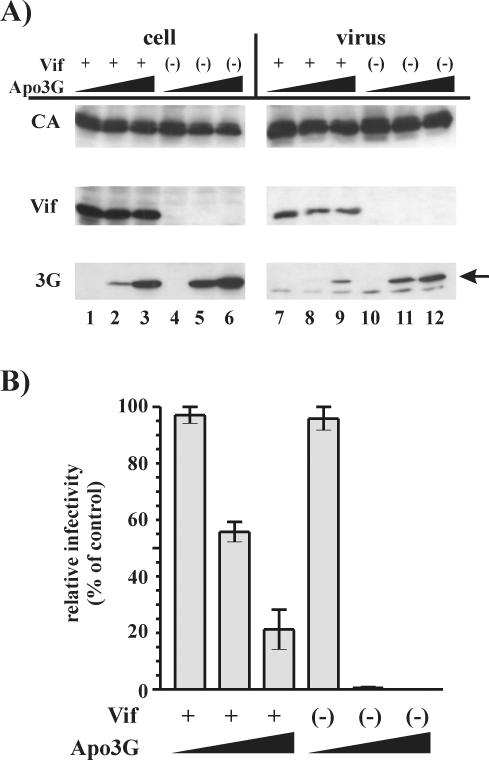
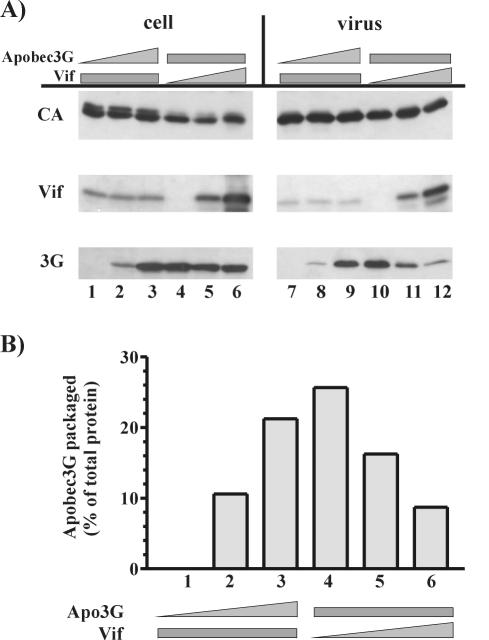
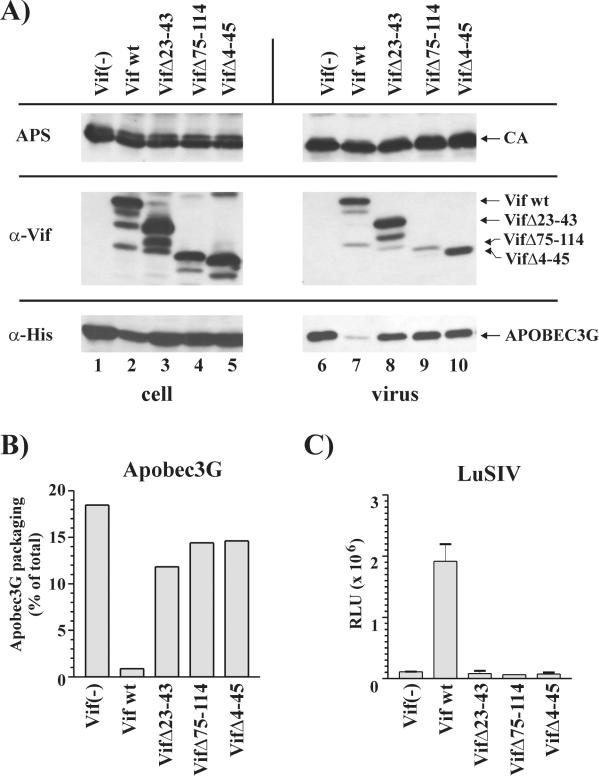
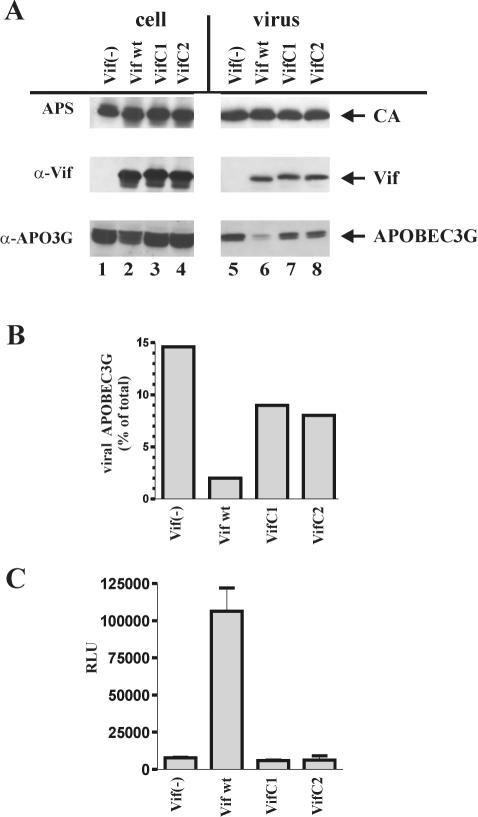
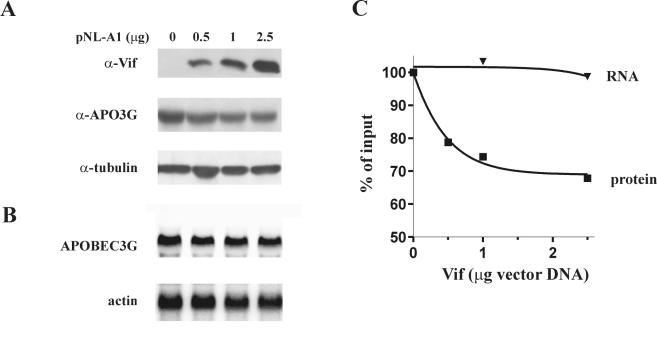
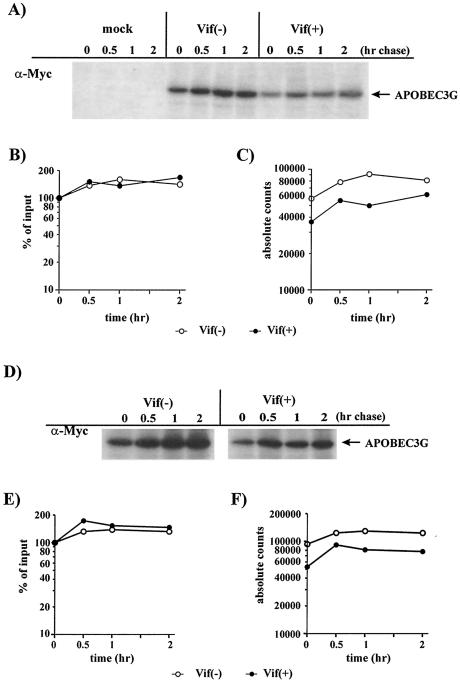
Replication of human immunodeficiency virus type 1 (HIV-1) in most primary cells and some immortalized T-cell lines depends on the activity of the viral infectivity factor (Vif). Vif has the ability to counteract a cellular inhibitor, recently identified as CEM15, that blocks infectivity of Vif-defective HIV-1 variants. CEM15 is identical to APOBEC3G and belongs to a family of proteins involved in RNA and DNA deamination. We cloned APOBEC3G from a human kidney cDNA library and confirmed that the protein acts as a potent inhibitor of HIV replication and is sensitive to the activity of Vif. We found that wild-type Vif inhibits packaging of APOBEC3G into virus particles in a dose-dependent manner. In contrast, biologically inactive variants carrying in-frame deletions in various regions of Vif or mutation of two highly conserved cysteine residues did not inhibit packaging of APOBEC3G. Interestingly, expression of APOBEC3G in the presence of wild-type Vif not only affected viral packaging but also reduced its intracellular expression level. This effect was not seen in the presence of biologically inactive Vif variants. Pulse-chase analyses did not reveal a significant difference in the stability of APOBEC3G in the presence or absence of Vif. However, in the presence of Vif, the rate of synthesis of APOBEC3G was slightly reduced. The reduction of intracellular APOBEC3G in the presence of Vif does not fully account for the Vif-induced reduction of virus-associated APOBEC3G, suggesting that Vif may function at several levels to prevent packaging of APOBEC3G into virus particles.


Figures

FIG. 1.
FIG. 1.
APOBEC3G inhibits HIV-1 infectivity. HeLa cells were transfected with 2.5 μg of pNL4-3 (Vif +) or pNL4-3Vif(−) (Vif −) together with 0, 1, or 2.5 μg of pcDNA-APO3G. All samples were adjusted to a total of 5 μg of DNA per transfection with empty vector DNA (pcDNA3.1MycHis). Cells and virus-containing supernatants were harvested 24 h later. A fraction of the virus (80%) was pelleted through a 20% sucrose cushion. The remaining virus was used for reverse transcription assay and infectivity analyses. (A) Whole-cell lysates (5% of total) and viral pellets (25% of total) were separated by SDS-13% polyacrylamide gel electrophoresis, transferred to polyvinylidene difluoride membranes, and reacted with a His-specific, HRP-conjugated monoclonal antibody (Invitrogen). Proteins were visualized by ECL (3G). The position of APOBEC3G is marked by an arrow. A nonspecific background band with slightly faster mobility was detected by the His-specific antiserum in this and some of the other experiments. The same blot was subsequently reblotted first with a Vif-specific monoclonal antibody (Vif), followed by an HIV-positive human serum (CA). (B) Infectivities of the viruses produced for panel A were determined by infecting LuSIV cells with equal amounts of virus as described in Materials and Methods. Infectivities of samples in the absence of APOBEC3G were defined as 100% for wild-type and Vif-defective viruses.
FIG. 2.
FIG. 2.
Vif inhibits packaging of APOBEC3G. (A) To determine the effects of APOBEC3G on Vif packaging, HeLa cells were transfected with 2.5 μg of pNL4-3 (expressing constant amounts of Vif) and 0, 0.5, or 2.5 μg of pcDNA-APO3G. Total DNA was adjusted in all samples to 5 μg with empty vector DNA. Samples were subjected to immunoblot analysis as described in the text. Lanes 1 to 3 and 7 to 9 represent cell and viral lysates, respectively. To determine the effect of Vif on APOBEC3G packaging, HeLa cells were transfected with 1.5 μg of pcDNA-APO3G together with 2.5 μg of the Vif-defective pNL4-3Vif(−) and 0, 0.5, or 2 μg of the Vif expression vector pNL-A1. Total DNA was adjusted to 6 μg with Vif-defective pNL-A1Vif(−) DNA. Lanes 4 to 6 and 10 to 12 represent cell and viral lysates, respectively. Capsid proteins were identified with an HIV-positive patient serum (CA). APOBEC3G was identified by using an HRP-conjugated anti-His monoclonal antibody (3G), and Vif was identified by using a Vif monoclonal antibody. (B) Packaging of APOBEC3G was quantified by densitometric scanning of the gels shown in panel A. Appropriate exposures were chosen to ensure that signal intensities were within the linear range of the X-ray film. The percentage of virus-associated protein relative to the total intracellular plus extracellular protein was calculated. Values were corrected for differences in the amount of capsid protein and loading volumes.
FIG. 3.
FIG. 3.
Inhibition of APOBEC3G packaging requires biologically active Vif. (A) HeLa cells were transfected with 2.5 μg of pNL4-3Vif(−), 1.5 μg of pcDNA-APO3G, and 1.5 μg of individual pNL-A1 variants. Lanes 1 and 6, Vif-deficient control; lanes 2 and 7, wild-type Vif. The other samples express Vif proteins carrying various in-frame deletions as indicated. Whole-cell lysates and virus fractions were prepared as described in the text and subjected to immunoblotting using an HIV-positive patient serum (APS) to recognize capsid proteins (CA), a Vif-specific monoclonal antibody (α-Vif), or a His-specific monoclonal antibody to detect APOBEC3G (α-His). The position of Vif variants is indicated on the right. (B) Packaging of APOBEC3G was quantitated by calculating the amounts of virus-associated proteins relative to the total intra- and extracellular proteins as described for Fig. 2. (C) LuSIV indicator cells were infected with comparable amounts of virus as determined by reverse transcripatse activity. Cells were harvested 24 h after infection and luciferase activity was determined as described in Materials and Methods. RLU, relative light units.
FIG. 4.
FIG. 4.
Two conserved cysteine residues in Vif are required to inhibit packaging of APOBEC3G. (A) HeLa cells were transfected with 2 μg of pNL4-3Vif(−), 1 μg of pcDNA-APO3G, and 2 μg of various pNL-A1 variants. Lanes 1 and 5, Vif-deficient control; lanes 2 and 6, wild-type Vif; lanes 3 and 7, VifC1 variants; lanes 4 and 8, VifC2 variants. Whole-cell lysates and virus fractions were prepared as described in the text and subjected to immunoblotting using an HIV-positive patient serum (APS) to recognize capsid proteins (CA), a Vif-specific monoclonal antibody (α-Vif), or an APOBEC3G-specific polyclonal antibody (α-APO3G). (B) Packaging of APOBEC3G was quantitated by calculating the amounts of virus-associated proteins relative to the total intra- and extracellular proteins as described for Fig. 3. (C) LuSIV indicator cells were infected with comparable amounts of virus as determined by RT activity. Cells were harvested 24 h after infection and luciferase activity was determined as described in Materials and Methods. RLU, relative light units.
FIG. 5.
FIG. 5.
Vif reduces intracellular levels of APOBEC3G. Duplicate flasks of HeLa cells (25 cm2) were each transfected with 2 μg of pHIV-APO3G and 0, 0.5, 1, or 2.5 μg of pNL-A1 plasmid DNA. All samples were adjusted to 5 μg of total DNA with pNL-A1Vif(−) DNA. Cells were harvested 24 h after transfection. Duplicate samples were pooled, and half of the cells were used to prepare whole-cell lysates for immunoblot analysis while the other half was used for preparation of total RNA for Northern blot analysis. (A) Cell lysates were subjected to immunoblotting using an APOBEC3G-specific polyclonal antiserum (α-APO3G) or a Vif-specific monoclonal antibody (α-Vif). To control for loading errors, the APOBEC3G blot was subsequently reblotted using an antibody against α-tubulin. (B) Total RNA was used for Northern blot analysis of APOBEC3G mRNA as described in Materials and Methods. For an internal control, an actin-specific probe was employed. (C) APOBEC3G-specific protein bands were quantified by densitometric scanning of the blot shown in panel A. APOBEC3G RNA signals shown in panel B were quantified using a Fuji phosphorimager. Protein signals were corrected for variations in the tubulin signal; RNA signals were normalized for actin. Results were calculated as percentages of the signals obtained in the absence of Vif (0) and plotted as a function of Vif expression.
FIG. 6.
FIG. 6.
Kinetic analysis of APOBEC3G. (A to C) Duplicate flasks of HeLa cells (25 cm2) were each transfected with 2 μg of pcDNA3.1 vector and 3 μg of pNL-A1 (mock), 2 μg of pcDNA-APO3G and 3 μg of pNL-A1vif(−) [Vif(−)], or 2 μg of pcDNA-APO3G and 3 μg of pNL-A1 [Vif(+)]. (D to F) Duplicate flasks of HeLa cells (25 cm2) were each transfected with 2 μg of pcDNA-APO3G and 3 μg of pNL4-3vif(−) [Vif(−)] or 2 μg of pcDNA-APO3G and 3 μg of wild-type pNL4-3 [Vif(+)]. Transfected cells were subjected to pulse-chase analysis followed by immunoprecipitation using a Myc-specific polyclonal rabbit antiserum as described in Materials and Methods. (A and D) Immunoprecipitated samples were subjected to 11% acrylamide-SDS gel electrophoresis and visualized by fluorometry. An increase in signal intensity was observed over time for all samples, presumably due to refolding of the protein. APOBEC3G-specific bands were quantified using a Fuji phosphorimager. Sample values were individually corrected for background and analyzed with Image Gauge, version 3.45, software (Fuji Photofilm LTD). In panels B and E, results are expressed as percentages of the starting sample (0 h of chase) and plotted as a function of time. In panels C and F, absolute phosphorimager values were plotted as a function of time.

Similar articles

Cited by

References

    1. Adachi, A., H. E. Gendelman, S. Koenig, T. Folks, R. Willey, A. Rabson, and M. A. Martin. 1986. Production of acquired immunodeficiency syndrome-associated retrovirus in human and nonhuman cells transfected with an infectious molecular clone. J. Virol. 59:284-291. - PMC - PubMed
    1. Akari, H., T. Uchiyama, T. Fukumori, S. Iida, A. H. Koyama, and A. Adachi. 1999. Pseudotyping human immunodeficiency virus type 1 by vesicular stomatitis virus G protein does not reduce the cell-dependent requirement of vif for optimal infectivity: functional difference between Vif and Nef. J. Gen. Virol. 80:2945-2949. - PubMed
    1. Bennett, M. K., N. Calakos, and R. H. Scheller. 1992. Syntaxin: a synaptic protein implicated in docking of synaptic vesicles at presynaptic active zones. Science 257:255-259. - PubMed
    1. Borman, A. M., C. Quillent, P. Charneau, C. Dauguet, and F. Clavel. 1995. Human immunodeficiency virus type 1 Vif-mutant particles from restrictive cells: role of Vif in correct particle assembly and infectivity. J. Virol. 69:2058-2067. - PMC - PubMed
    1. Bour, S., and K. Strebel. 2000. HIV accessory proteins: multifunctional components of a complex system. Adv. Pharmacol. 48:75-120. - PubMed

Publication types

LinkOut - more resources