. 2003 Nov;77(21):11718-32.
doi: 10.1128/jvi.77.21.11718-11732.2003.

Array analysis of viral gene transcription during lytic infection of cells in tissue culture with Varicella-Zoster virus

Affiliations

Array analysis of viral gene transcription during lytic infection of cells in tissue culture with Varicella-Zoster virus

Randall J Cohrs et al. J Virol. 2003 Nov.

Abstract

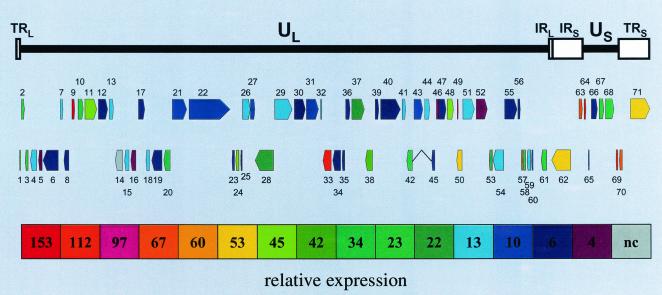
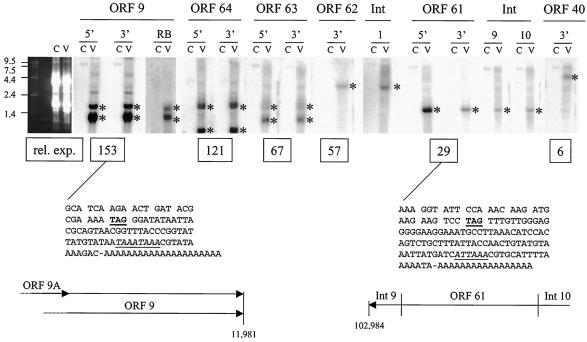
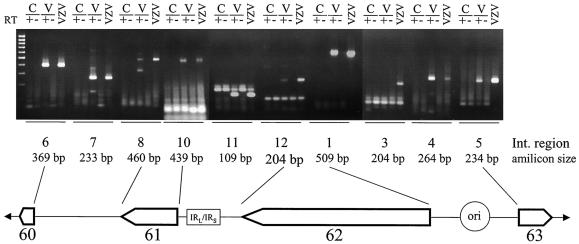
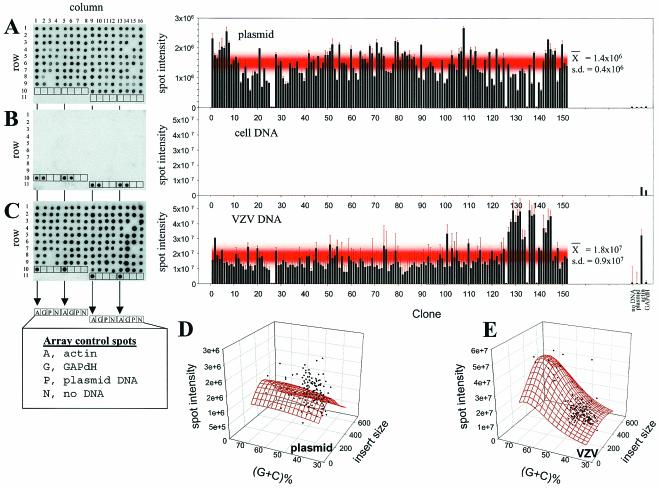
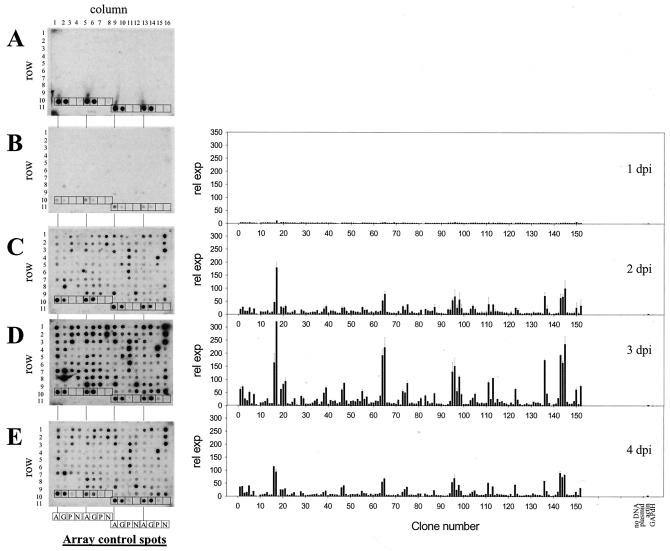
Varicella-zoster virus (VZV), a neurotropic alphaherpesvirus, causes childhood chickenpox (varicella), becomes latent in dorsal root and autonomic ganglia, and reactivates decades later to cause shingles (zoster) and other neurologic complications. Although the sequence and configuration of VZV DNA have been determined, relatively little is known about viral gene expression in productively infected cells. This is in part because VZV is highly cell associated, and sufficient titers of cell-free virus for use in synchronizing infection do not develop. PCR-based transcriptional arrays were constructed to simultaneously determine the relative abundance of the approximately 70 predicted VZV open reading frames (ORFs). Fragments (250 to 600 bp) from the 5' and 3' end of each ORF were PCR amplified and inserted into plasmid vectors. The virus DNA inserts were amplified, quantitated, and spotted onto nylon membranes. Probing the arrays with radiolabeled cDNA synthesized from VZV-infected cells revealed an increase in the magnitude of the expressed VZV genes from days 1 to 3 after low-multiplicity virus infection but little change in their relative abundance. The most abundant VZV transcripts mapped to ORFs 9/9A, 64, 33/33A, and 49, of which only ORF 9 corresponded to a previously identified structural gene. Array analysis also mapped transcripts to three large intergenic regions previously thought to be transcriptionally silent, results subsequently confirmed by Northern blot and reverse transcription-PCR analysis. Array analysis provides a formidable tool to analyze transcription of an important ubiquitous human pathogen.


Figures

FIG. 3.
FIG. 3.
Relative expression of VZV genes during lytic infection. The VZV genome consists of unique long (UL) and short (US) segments, each bounded by terminal and internal inverted repeated DNA sequences (TRL/IRL and IRs/TRs). Transcription of VZV genes was determined during lytic virus growth in cell culture (Fig. 2), and relative expression of virus genes was assessed (Table 3). The relative size, direction of transcription, and expression of each of the 71 predicted virus ORFs show that the most abundant transcripts (ORFs 9, 33, 49, 63/70, and 64/69) mapped across the virus genome.
FIG. 4.
FIG. 4.
Northern blot analysis of VZV transcripts. Control (C) and VZV-infected (V) cell RNA was resolved on denaturing gels and hybridized to PCR-generated probes specific for the 5′ or 3′ end of ORFs 9, 64, 63, 62, 61. and 40, the antisense oligonucleotide 9RB (Table 1), or the PCR-generated intergenic (Int) fragments 1, 9, and 10. Asterisks indicate major bands detected in each lane. The relative expression (rel. exp.) of each ORF determined by array analysis (Table 3) is listed below the respective Northern blot. The DNA sequences of the ORF 9 and ORF 61 termini determined by 3′-RACE are also listed. The termination codon (TAG) is underlined, and the putative poly(A) addition signal is both italicized and underlined. The proposed ORF 9A, 9, and 61 mRNA structures are shown at the bottom of the figure.
FIG. 5.
FIG. 5.
RT-PCR analysis of VZV intergenic DNA. Control (C) and VZV-infected (V) cell RNA was incubated with (+) or without (−) reverse transcriptase and PCR amplified with selected intergenic (Int)-specific primers. Amplified products were compared with those after PCR amplification of VZV DNA. The predicted size of the amplification product (amplicon size) for each Int region primer set is listed. Int regions 6 to 8 map between ORFs 60 and 61; Int regions 10 to 12 map between ORFs 61 and 62 and contain the IRL/IRS junction; and Int regions 1 to 5 map between ORFs 62 and 63 and contain the VZV DNA origin replication (ori).
FIG. 1.
FIG. 1.
Specificity of VZV arrays. VZV arrays were incubated with 32P-end-labeled vector primer (A), 32P-nick-translated control cell DNA (B), or VZV DNA (C) probes. All arrays were configured the same; Table 2 lists the location (column and row) of the 152 VZV DNA ORF targets. Each array also contained a quadruplet set of four control targets. Control targets in each array consisted of actin (row 10, columns 1 and 5; row 11, columns 9 and 13), GAPdH (row 10, columns 2 and 6; row 11, columns 10 and 14), plasmid DNA (row 10, columns 3 and 7; row 11, columns 11 and 15), and no DNA (row 10, columns 4 and 8; row 11, columns 12 and 16). After hybridization, the intensity of each spot was quantitated by phosphoimaging. The graph to the right of each array shows the spot intensity (arbitrary units) associated with each of the 152 VZV target clones, along with the average spot intensity associated with the array controls. Error bars indicate the standard error of the mean for each data point. The red shaded regions in the graphs show the mean ± 1 standard deviation for the VZV target DNAs. The three-dimensional Lorentzian transformation of spot intensity versus insert molar G+C and insert size (in base pairs) revealed no statistical correlation when the array was probed with the plasmid oligonucleotide (D), but a slight correlation between spot intensity and insert G+C content when the array was probed with VZV DNA (E).
FIG. 2.
FIG. 2.
Array analysis of VZV transcripts during lytic infection. Arrays were hybridized to probes synthesized from control cell RNA (A) or RNA extracted from VZV-infected cells harvested 1 day postinfection (dpi) (B), 2 days postinfection (C), 3 days postinfection (D), or 4 days postinfection (E). VZV DNA target and control spots are configured on each array as described in the Fig. 1 legend. After hybridization, spot intensities were determined and normalized to the values obtained from the array hybridized with the control cell probe. Graphs show the relative expression (rel. exp.) associated with each VZV DNA target clone and the control spots in the arrays. The overall abundance of VZV transcription peaked at 3 days postinfection, when targets mapping to all possible virus genes were detected.

Similar articles

Cited by

References

    1. Blaho, J. A., C. Mitchell, and B. Roizman. 1994. An amino acid sequence shared by the herpes simplex virus 1 alpha regulatory proteins 0, 4, 22, and 27 predicts the nucleotidylylation of the UL21, UL31, UL47, and UL49 gene products. J. Biol. Chem. 269:17401-17410. - PubMed
    1. Bresnahan, W. A., and T. Shenk. 2000. A subset of viral transcripts packaged within human cytomegalovirus particles. Science 288:2373-2376. - PubMed
    1. Brunell, P. A., L. C. Ren, J. I. Cohen, and S. E. Straus. 1999. Viral gene expression in rat trigeminal ganglia following neonatal infection with varicella-zoster virus. J. Med. Virol. 58:286-290. - PubMed
    1. Cohen, J. I., and H. Nguyen. 1998. Varicella-zoster virus ORF61 deletion mutants replicate in cell culture, but a mutant with stop codons in ORF61 reverts to wild-type virus. Virology 246:306-316. - PubMed
    1. Cohrs, R., and H. Rouhandeh. 1987. Analysis of Herpesvirus sylvilagus-induced proteins in infected rabbit kidney cells by two-dimensional gel electrophoresis. Intervirology 28:206-220. - PubMed

Publication types

LinkOut - more resources