. 2003 Nov;23(21):7628-37.
doi: 10.1128/MCB.23.21.7628-7637.2003.

Transcription factor and polymerase recruitment, modification, and movement on dhsp70 in vivo in the minutes following heat shock

Affiliations

Transcription factor and polymerase recruitment, modification, and movement on dhsp70 in vivo in the minutes following heat shock

Amber K Boehm et al. Mol Cell Biol. 2003 Nov.

Abstract

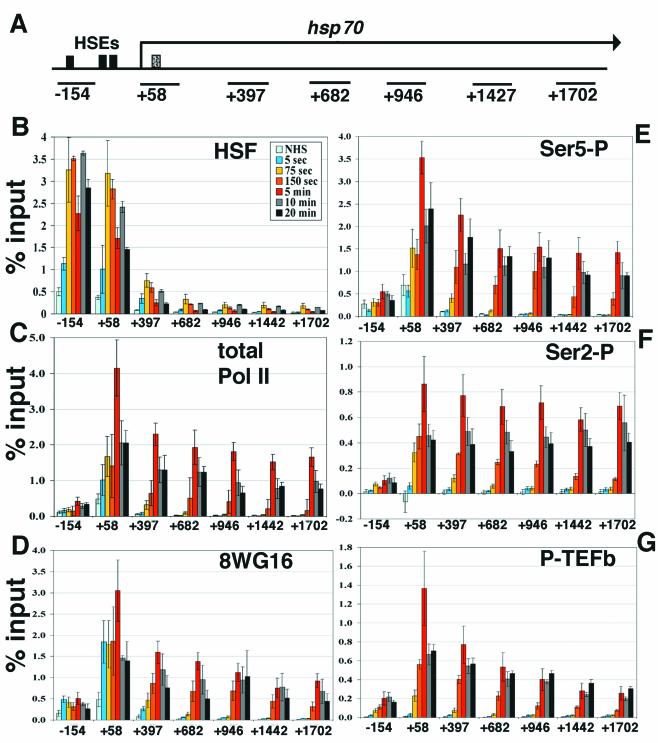
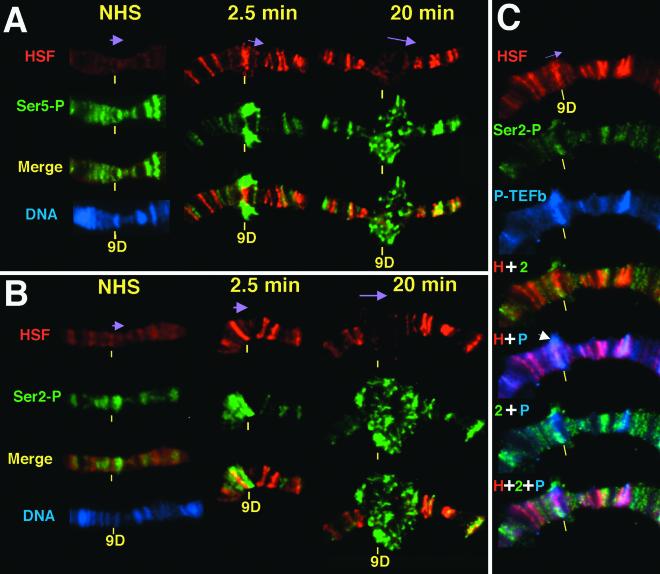
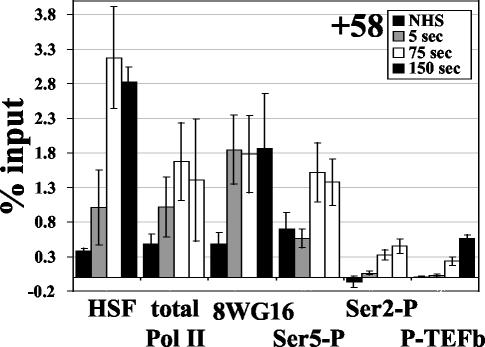
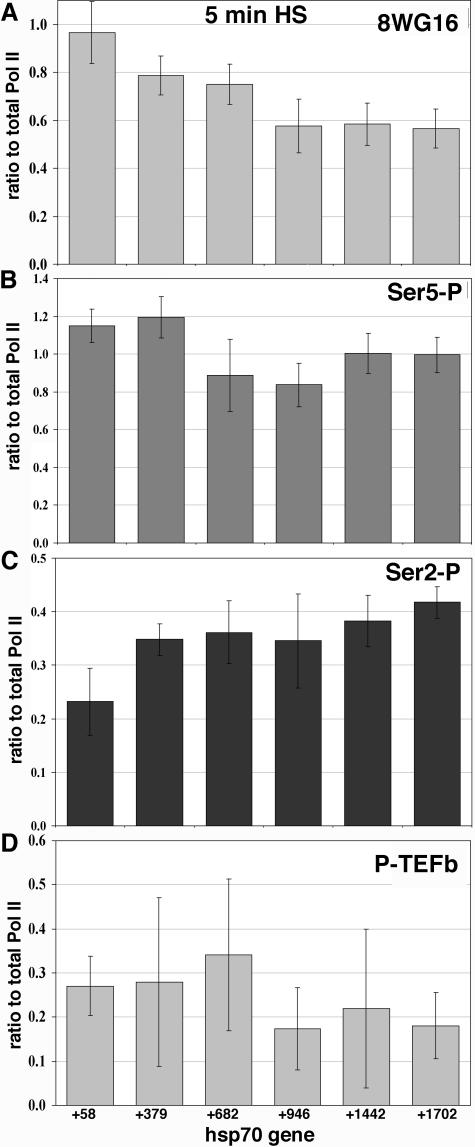
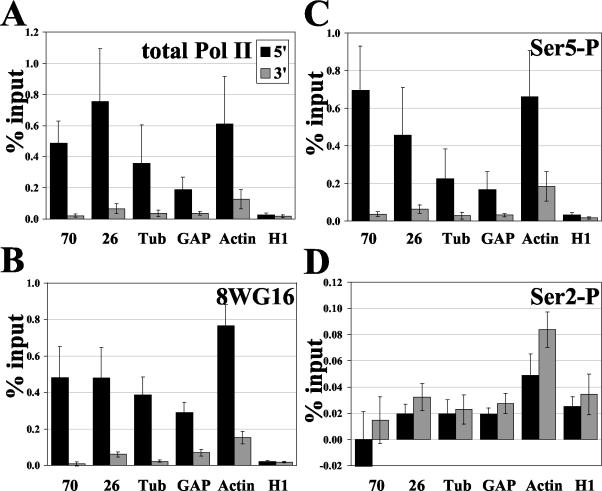
The uninduced Drosophila hsp70 gene is poised for rapid activation. Here we examine the rapid changes upon heat shock in levels and location of heat shock factor (HSF), RNA polymerase II (Pol II) and its phosphorylated forms, and the Pol II kinase P-TEFb on hsp70 in vivo by using both real-time PCR assays of chromatin immunoprecipitates and polytene chromosome immunofluorescence. These studies capture Pol II recruitment and progression along hsp70 and reveal distinct spatial and temporal patterns of serine 2 and serine 5 phosphorylation: in uninduced cells, the promoter-paused Pol II shows Ser5 but not Ser2 phosphorylation, and in induced cells the relative level of Ser2-P Pol II is lower at the promoter than at regions downstream. An early time point of heat shock activation captures unphosphorylated Pol II recruited to the promoter prior to P-TEFb, and during the first wave of transcription Pol II and the P-TEFb kinase can be seen tracking together across hsp70 with indistinguishable kinetics. Pol II distributions on several other genes with paused Pol II show a pattern of Ser5 and Ser2 phosphorylation similar to that of hsp70. These studies of factor choreography set important limits in modeling transcription regulatory mechanisms.


Figures

FIG. 1.
FIG. 1.
Kinetic analyses of hsp70 transcription by ChIP and real-time PCR. (A) Schematic of hsp70. Solid black boxes indicate HSE sites (−175, −75, −55 from transcription start site) (54), and the dotted box indicates the site of paused Pol II (+21 to +35) (39). Black lines below the gene indicate the regions amplified by primer sets (see Materials and Methods), identified by the nucleotide at the center of the amplified region. (B) Time course of HSF recruitment on hsp70. ChIP samples were taken at several time points, analyzed by real-time PCR with the primer sets along hsp70 shown in panel A, and compared to percentage input material. Samples shown are NHS and 5-s, 75-s, 150-s, 5-min, 10-min, and 20-min instantaneous heat shock. The x axis is the hsp70 gene in nucleotides, and the y axis is percentage input. The identity of each time point line is located in the upper right-hand corner of the graph. Standard error bars are shown; n = 4, 3, 7, 4, 4, 5, and 4, respectively. (C) Kinetics of total Pol II. Standard error bars are shown; n = 4, 4, 8, 3, 4, 4, and 4, respectively. (D) Antibody 8WG16, which detects unphosphorylated Pol II CTD repeats. Standard error bars are shown; n = 4, 4, 7, 4, 5, 4, and 4, respectively. (E) Time course of Ser5 phosphorylation, detected by antibody H14. Standard error bars are shown; n = 4, 3, 7, 4, 5, 4, and 4, respectively. (F) Ser2 phosphorylation kinetics on hsp70, detected by H5. Standard error bars are shown; n = 4, 4, 8, 3, 4, 4, and 4, respectively. (G) ChIP analysis of P-TEFb by using an antibody to CycT. Standard error bars are shown; n = 3, 3, 8, 4, 5, 4, and 4, respectively.
FIG. 2.
FIG. 2.
Kinetics of Pol II phosphorylation during heat shock induction on Drosophila polytene chromosomes and localization of HSF, Ser2-P, and P-TEFb in the active hsp70 puff. Shown is the transgenic hsp70-lacZ gene, located at 9DE in Bg9 flies (23), precisely mapped by electron microscopy to the end of 9D (46). Chromosomes were prepared as previously described (21) and were stained with antibodies to HSF (red) and either Ser5-P (green) in panel A or Ser2-P (green) in panels B and C, as well as P-TEFb (blue) in panel C. Purple arrows indicate the direction of transcription. (A and B) Time course is as indicated. Images underwent three-dimensional restoration. (C) Chromosomes were heat shocked for 2.5 min. Merged images show the various combinations of HSF (H), Ser2-P (2), and P-TEFb (P) immunofluorescence, as indicated by the plus sign. The white arrow indicates where P-TEFb and Ser2-P expand into the puff, resolving from HSF. These images did not undergo three-dimensional restoration.
FIG. 3.
FIG. 3.
Early events of transcription at the hsp70 promoter. Comparison of recruitment kinetics of factors or modifications at the earliest time points of transcription at the region encompassing the paused Pol II.
FIG. 4.
FIG. 4.
Tracking the Pol II modifications and P-TEFb association with Pol II relative to total Pol II levels at the peak of factor association during heat shock. For each gene region the value for the Pol II phosphorylation state or for P-TEFb was divided by the value for total Pol II at 5 min of heat shock (thus, total Pol II/total Pol II = 1). Antibody target is indicated in the upper right-hand corner of each graph. Standard deviation for each point is shown, determined by the square root of the sum of the squares of (i) the standard deviation oftotal Pol II for that gene region and (ii) the standard deviation associated with the values of each phosphorylation state. (A) Ratio of 8WG16, unphosphorylated Pol II CTD, to total Pol II. (B) Ratio of Ser5-P signal to total Pol II. (C) Ser2-P signal ratio to total Pol II. (D) The levels of P-TEFb compared to those of total Pol II.
FIG. 5.
FIG. 5.
Analysis of Pol II and its various phosphorylation states on additional genes with characterized pause states. All genes were tested in the NHS, or uninduced, state. For panels A to D, standard error n values are the same and are as follows: hsp70, n = 4; hsp26, n = 10; Tub, n = 7; GAP, n = 10; Actin5C, n = 10; and H1, n = 7. (A) ChIP analysis of total Pol II on genes in addition to hsp70. (B) Unphosphorylated Pol II CTD, 8WG16. (C) Ser5 phosphorylation. (D) Ser2 phosphorylation.

References

    1. Allison, L. A., M. Moyle, M. Shales, and C. J. Ingles. 1985. Extensive homology among the largest subunits of eukaryotic and prokaryotic RNA polymerases. Cell 42:599-610. - PubMed
    1. Andrulis, E. D., E. Guzman, P. Doring, J. Werner, and J. T. Lis. 2000. High-resolution localization of Drosophila Spt5 and Spt6 at heat shock genes in vivo: roles in promoter proximal pausing and transcription elongation. Genes Dev. 14:2635-2649. - PMC - PubMed
    1. Cheng, C., and P. A. Sharp. 2003. RNA polymerase II accumulation in the promoter-proximal region of the dihydrofolate reductase and γ-actin genes. Mol. Cell. Biol. 23:1961-1967. - PMC - PubMed
    1. Cho, E. J., M. S. Kobor, M. Kim, J. Greenblatt, and S. Buratowski. 2001. Opposing effects of Ctk1 kinase and Fcp1 phosphatase at Ser 2 of the RNA polymerase II C-terminal domain. Genes Dev. 15:3319-3329. - PMC - PubMed
    1. Cho, E. J., T. Takagi, C. R. Moore, and S. Buratowski. 1997. mRNA capping enzyme is recruited to the transcription complex by phosphorylation of the RNA polymerase II carboxy-terminal domain. Genes Dev. 11:3319-3326. - PMC - PubMed

Publication types

MeSH terms

LinkOut - more resources