. 2003 Nov;185(21):6392-9.
doi: 10.1128/JB.185.21.6392-6399.2003.

Genome-scale analysis of the uses of the Escherichia coli genome: model-driven analysis of heterogeneous data sets

Affiliations

Genome-scale analysis of the uses of the Escherichia coli genome: model-driven analysis of heterogeneous data sets

Timothy E Allen et al. J Bacteriol. 2003 Nov.

Abstract

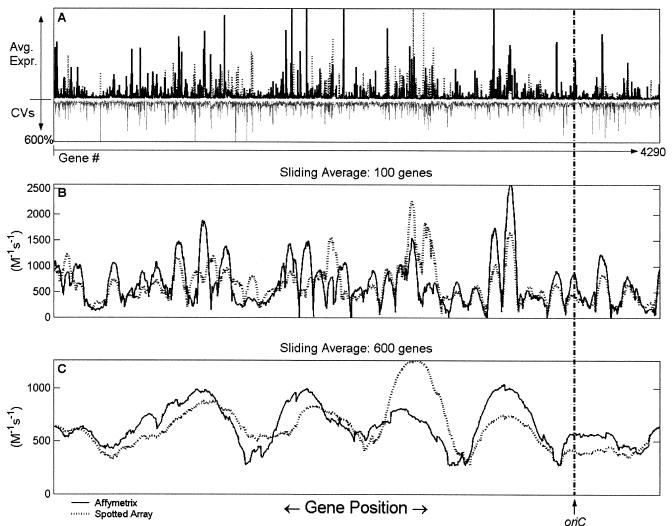
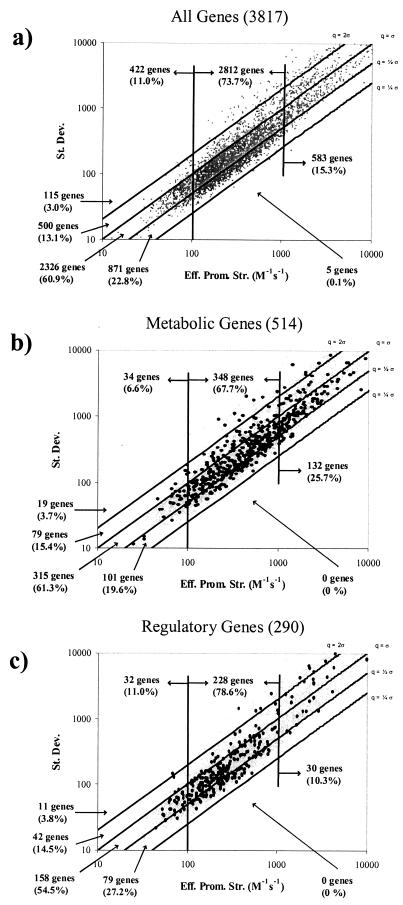
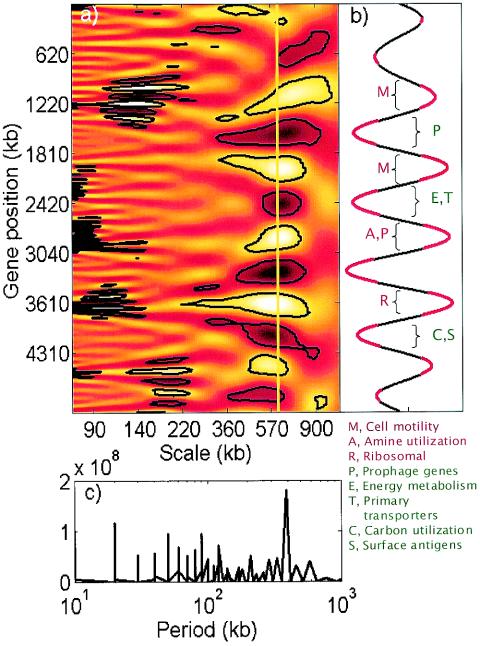
The recent availability of heterogeneous high-throughput data types has increased the need for scalable in silico methods with which to integrate data related to the processes of regulation, protein synthesis, and metabolism. A sequence-based framework for modeling transcription and translation in prokaryotes has been established and has been extended to study the expression state of the entire Escherichia coli genome. The resulting in silico analysis of the expression state highlighted three facets of gene expression in E. coli: (i) the metabolic resources required for genome expression and protein synthesis were found to be relatively invariant under the conditions tested; (ii) effective promoter strengths were estimated at the genome scale by using global mRNA abundance and half-life data, revealing genes subject to regulation under the experimental conditions tested; and (iii) large-scale genome location-dependent expression patterns with approximately 600-kb periodicity were detected in the E. coli genome based on the 49 expression data sets analyzed. These results support the notion that a structured model-driven analysis of expression data yields additional information that can be subjected to commonly used statistical analyses. The integration of heterogeneous genome-scale data (i.e., sequence, expression data, and mRNA half-life data) is readily achieved in the context of an in silico model.


Figures

FIG. 1.
FIG. 1.
Calculated average effective promoter strengths at different sliding average scales. The cellular parameters were chosen for a doubling time of 40 min (see Table 1), with an RNAP concentration of 1.456 × 10⁻⁶ M (8). The concentration of each promoter was chosen based on a C period of 45 min and a D period of 25 min (8), where the C period refers to the time between initiation and completion of one round of chromosomal replication, and the D period refers to the interval between the end of replication and cell division (22). The location of the origin of replication (oriC) is indicated for reference. (A) Plots of mean expression levels and CVs for the 20 Affymetrix data sets and the 29 spotted array data sets. The solid bars represent the mean effective promoter strengths calculated from experiments performed with Affymetrix arrays, the dotted bars represent the effective promoter strengths calculated from spotted array experiments; and the grey bars represent the CVs spanning all 49 data sets used in the calculations. (B) Plot of mean expression levels over a sliding average (with second-order Savitzky-Golay smoothing) of 100 genes for the Affymetrix array (solid line) and the spotted array (dotted line) data sets. (C) Same as panel B, but the sliding average was taken over a 600-gene window.
FIG.2.
FIG.2.
Log-log plots of the standard deviations (St. Dev.) versus mean effective promoter strengths (Eff. Prom. Str.) for individual ORFs in 49 expression data sets. The gene information outside each plot indicates the numbers of genes between CV demarcations, and the gene information inside each plot indicates the numbers of genes whose promoter strengths were less than 100 M−1 s−1, between 100 and 1,000 M−1 s−1, and greater than 1,000 M−1 s−1. (a) Plot of all 3,817 genes for which effective promoter strengths were calculated. (b) Overlay of 514 metabolic genes (12). (c) Overlay of 290 regulatory genes (34).
FIG. 3.
FIG. 3.
Spatial variability of gene expression along the E. coli genome studied by using continuous wavelet and Fourier transforms of the effective promoter strength data. (a) Scalogram of the wavelet transform with the gene position on the y axis and the transform scale on the x axis. Lighter and darker regions correspond to higher and lower values of the coefficients, respectively. The regions enclosed by black contour lines were deemed to be statistically significant patterns compared to spatially randomized effective promoter strengths (P < 0.001). (b) Cross section of the wavelet scalogram in panel A at a scale of 610 kb. The regions with significantly nonrandom wavelet coefficients are indicated by red. Gene functional classes (classified according to GenProtEC 38) preferentially located in particular high-expression (red) or low-expression (green) regions (hypergeometric P < [0.001/number of functional classes]) are also indicated. (c) Fourier transform analysis of the effective promoter strength data. The only significant peak in the transform occurs at the approximately 600-kb period.

References

    1. Akashi, H., and T. Gojobori. 2002. Metabolic efficiency and amino acid composition in the proteomes of Escherichia coli and Bacillus subtilis. Proc. Natl. Acad. Sci. USA 99:3695-3700. - PMC - PubMed
    1. Allen, T. E., and B. O. Palsson. 2003. Sequence-based analysis of metabolic demands for protein synthesis in prokaryotes. J. Theor. Biol. 220:1-18. - PubMed
    1. Altman, R. B., and S. Raychaudhuri. 2001. Whole-genome expression analysis: challenges beyond clustering. Curr. Opin. Struct. Biol. 11:340-347. - PubMed
    1. Arfin, S. M., A. D. Long, E. T. Ito, L. Tolleri, M. M. Riehle, E. S. Paegle, and G. W. Hatfield. 2000. Global gene expression profiling in Escherichia coli K12. The effects of integration host factor. J. Biol. Chem. 275:29672-29684. - PubMed
    1. Bentley, P. M., and J. T. E. McDonnell. 1994. Wavelet transforms: an introduction. IEE Electron. Commun. Eng. J. 6:175-186.

Publication types

MeSH terms

Substances

LinkOut - more resources