. 2004 Mar;5(1):32-48.
doi: 10.1007/s10162-003-3057-7. Epub 2003 Oct 20.

Cortical responses to cochlear implant stimulation: channel interactions

Affiliations

Cortical responses to cochlear implant stimulation: channel interactions

Julie Arenberg Bierer et al. J Assoc Res Otolaryngol. 2004 Mar.

Abstract

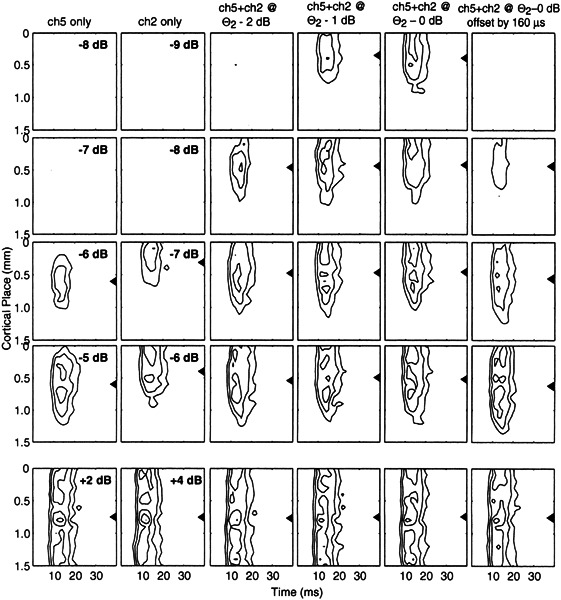
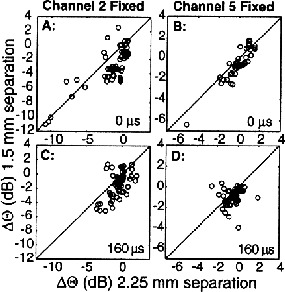
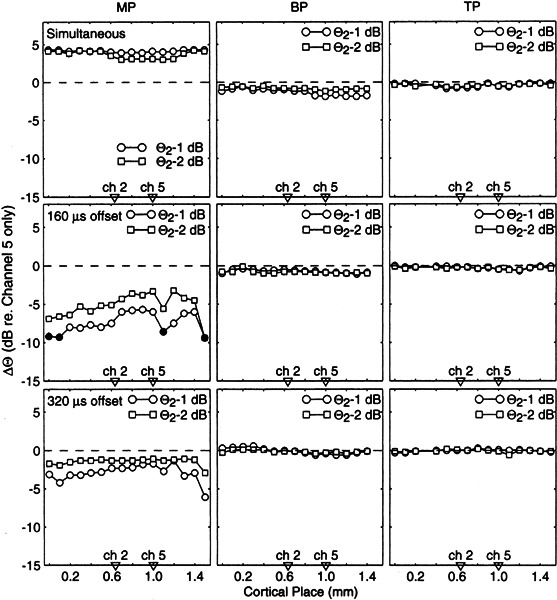
This study examined the interactions between electrical stimuli presented through two channels of a cochlear implant. Experiments were conducted in anesthetized guinea pigs. Multiunit spike activity recorded from the auditory cortex reflected the cumulative effects of electric field interactions in the cochlea as well as any neural interactions along the ascending auditory pathway. The cochlea was stimulated electrically through a 6-electrode intracochlear array. The stimulus on each channel was a single 80- micro s/phase biphasic pulse. Channel interactions were quantified as changes in the thresholds for elevation of cortical spike rates. Experimental parameters were interchannel temporal offset (0 to +/-2000 micro s), interelectrode cochlear spacing (1.5 or 2.25 mm), electrode configuration (monopolar, bipolar, or tripolar), and relative polarity between channels (same or inverted). In most conditions, presentation of a subthreshold pulse on one channel reduced the threshold for a pulse on a second channel. Threshold shifts were greatest for simultaneous pulses, but appreciable threshold reductions could persist for temporal offsets up to 640 micro s. Channel interactions varied strongly with electrode configuration: threshold shifts increased in magnitude in the order tripolar, bipolar, monopolar. Channel interactions were greater for closer electrode spacing. The results have implications for design of speech processors for cochlear implants.


Figures

Figure 1
Figure 1
Schematics of two-channel stimuli. Each channel was stimulated with a biphasic pulse of duration 80 µs/phase, represented by the solid line in each panel. The broken lines represent the stimulus on the more apical channel. Temporal offsets were measured from the beginning of the first pulse to the beginning of the second. In each panel, temporal offsets of 0, 160, 320, and 2000 µs, respectively, are shown. Top and bottom panels represent the same- and inverted-polarity conditions.
Figure 2
Figure 2
Cortical images of one- and two-channel stimuli. Each panel represents the cortical image of one stimulus averaged across 10 trials. The left two columns represent responses to single-channel stimulation of channels 5 (first column) and 2 (second column). Current levels are expressed in dB re: 1 mA. Columns 3, 4, and 5 represent two-channel stimulation in the simultaneous condition with the current level on channel 2 fixed at 2, 1, and 0 dB, respectively, below the threshold for channel 2 alone (i.e., Θ2−2, Θ2−1, and Θ2). The rightmost column represents a condition in which the stimulus level on channel 2 was fixed at Θ2 with a temporal offset of 160 µs. For each cortical image, the abscissa represents poststimulus time and the ordinate represents cortical place relative to the most caudal recording site. Contours represent mean spike counts expressed as percent of the maximum count on each cortical channel; contours are drawn at 20, 40, 60, and 80% of the maximum count. Triangles to the right of each panel represent the centroid locations. Data are from animal GP02.
Figure 3
Figure 3
Rate-versus-level functions for three recording sites and three temporal offsets. Each column of panels represents responses obtained from one recording site, 300, 800, or 1100 µm relative to the most caudal site. Rows of panels represent responses to simultaneous (top), 160-µs offset (middle) and 320-µs offset (bottom). For each panel, the abscissa represents the stimulus current level delivered to channel 5 and the ordinate represents the normalized spike rate. Rate-level functions are drawn for stimulation of channel 5 alone (circles) or with the current level on channel 3 constant at its threshold of −6 dB re: 1 mA (squares) or constant at −7 dB re: 1 mA (asterisks). Filled triangles indicate threshold current levels in the one- and two-channel conditions. Data are from animal GP43.
Figure 4
Figure 4
Threshold shifts across cortical recording sites for three stimulus configurations and three temporal offsets. The left, middle, and right columns represent threshold shifts for MP, BP, andTP configurations, respectively. The abscissa and ordinate are cortical place along the recording electrode and threshold shift, respectively. Threshold shifts indicate thresholds in the presence of a channel 2 stimulus relative to the threshold in the channel-5-alone condition. Circles and squares indicate conditions in which the channel 2 stimulus was presented at levels 1 or 2 dB below the threshold for response to channel 2 alone. Filled symbols indicate instances at which the lowest level tested was above threshold, i.e., the true threshold was lower than the plotted value. The arrows at the lower edge of each plot indicate the locations of cortical centroids for channels 2 and 5. Data are from animal GP02.
Figure 5
Figure 5
Differences between threshold shifts measured at the channel 2 or channel 3 centroid compared with that measured at the channel 5 centroid. Points falling above the positive diagonal indicate threshold shifts were greater for sites near the channel 2 or channel 3 centroid. The distribution is collapsed across active electrode separations of 1.5 and 2.25 mm.
Figure 6
Figure 6
Threshold shifts for two BP channel separations. Each panel shows the threshold shifts measured in response to two-channel stimulation with a channel separation of 2.25 mm compared with that of 1.5 mm. Symbols represent every recording channel in which thresholds could be computed for both separations (i.e., 8 animals, as many as 16 channels per subject). The left column of panels shows threshold shifts in the condition in which the current on the more basal channel (i.e., channel 2 or 3) was fixed at 1 dB below its threshold, and the right column of panels shows threshold shifts for the condition in which the current on the more apical channel was fixed. Upper and lower rows of panels represent simultaneous and 160-µs offset conditions. Points falling below the positive diagonal indicate threshold shifts that were greater for smaller active electrode separations.
Figure 7
Figure 7
Threshold shifts as a function of temporal offset. Each panel shows data from one animal, indicated by the number in the lower right corner. Symbol shapes represent electrode configuration. The filled symbols represent responses to the simultaneous condition. The open symbols represent threshold shifts measured in response to varying temporal offsets from 160 to 2000 µs. The lines show the least-squared fits to the nonsimultaneous MP data (open squares). In each case, threshold shifts were measured at the cortical site closest to the fixed-level (channel 2 or 3) centroid.
Figure 8
Figure 8
Sensitivity to the order of fixed- and variable-level channels. The plots compare threshold shifts in conditions in which the pulse on the fixed-level channel led (horizontal coordinate) or lagged (vertical coordinate) the pulse on the channel that was varied in current level. Data are compiled across all animals, configurations, and active electrode separations.
Figure 9
Figure 9
Threshold shifts across cortical recording sites for inverted-phase stimulation for MP, BP, and TP electrode configurations and three temporal offsets. Conventions are as in Fig. 4. Data are from animal GP38.

References

    1. Arenberg JG, Furukawa S, Middlebrooks JC. Auditory cortical images of tones and noise bands. J. Assoc. Res. Otolaryngol. 2000;1:183–194. - PMC - PubMed
    1. Battmer RD, Zilberman Y, Haake P, Lenarz T. Simultaneous Analog Stimulation (SAS)—Continuous Interleaved Sampler (CIS) pilot comparison study in Europe. Ann. Otol. Rhinol. Laryngol. Suppl. 1999;177:69–73. - PubMed
    1. Bierer JA, Middlebrooks JC. Auditory cortical images of cochlear-implant stimuli: Dependence on electrode configuration. J. Neurophysiol. 2002;87:478–492. - PubMed
    1. Bruce IC, Irlicht LS, White MW, O’Leary SJ, Dynes S, Javel E, Clark GM. A stochastic model of the electrically stimulated auditory nerve: Pulse-train response. IEEE Trans. Biomed. Eng. 1999;46:630–637. doi: 10.1109/10.764939. - DOI - PubMed
    1. Cartee LA, van den Honert C, Finley CC, Miller RL. Evaluation of a model of the cochlear neural membrane. I. Physiological measurement of membrane characteristics in response to intrameatal electrical stimulation. Hear. Res. 2000;146:143–152. doi: 10.1016/S0378-5955(00)00109-X. - DOI - PubMed

Publication types