

Ordered-subsets linkage analysis detects novel Alzheimer disease loci on chromosomes 2q34 and 15q22
- PMID: 14564669
- PMCID: PMC1180484
- DOI: 10.1086/379083
Ordered-subsets linkage analysis detects novel Alzheimer disease loci on chromosomes 2q34 and 15q22
Abstract
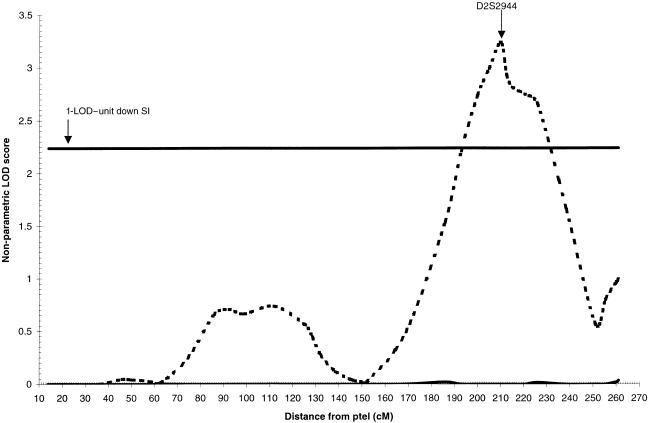
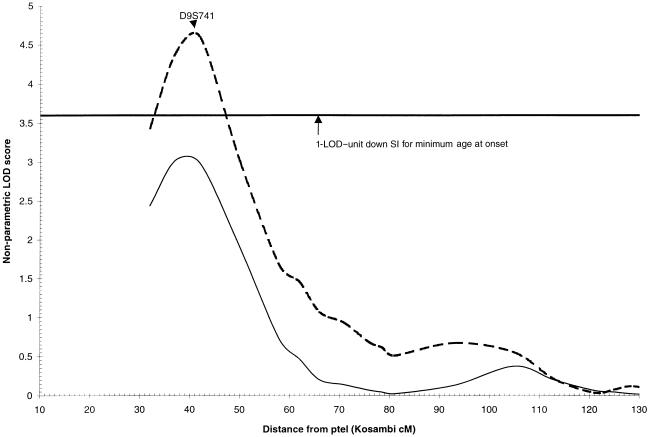
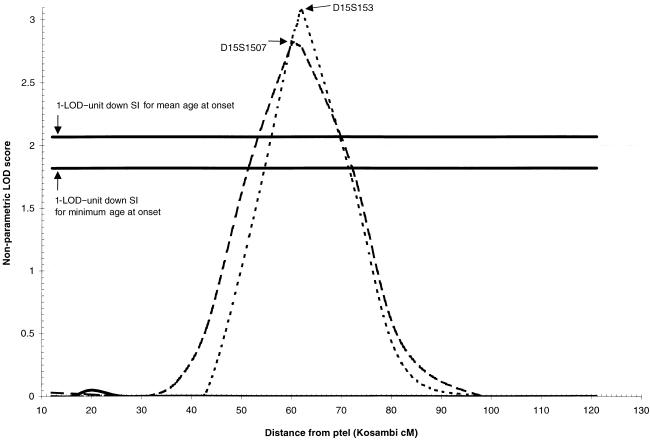
Alzheimer disease (AD) is a complex disorder characterized by a wide range, within and between families, of ages at onset of symptoms. Consideration of age at onset as a covariate in genetic-linkage studies may reduce genetic heterogeneity and increase statistical power. Ordered-subsets analysis includes continuous covariates in linkage analysis by rank ordering families by a covariate and summing LOD scores to find a subset giving a significantly increased LOD score relative to the overall sample. We have analyzed data from 336 markers in 437 multiplex (>/=2 sampled individuals with AD) families included in a recent genomic screen for AD loci. To identify genetic heterogeneity by age at onset, families were ordered by increasing and decreasing mean and minimum ages at onset. Chromosomewide significance of increases in the LOD score in subsets relative to the overall sample was assessed by permutation. A statistically significant increase in the nonparametric multipoint LOD score was observed on chromosome 2q34, with a peak LOD score of 3.2 at D2S2944 (P=.008) in 31 families with a minimum age at onset between 50 and 60 years. The LOD score in the chromosome 9p region previously linked to AD increased to 4.6 at D9S741 (P=.01) in 334 families with minimum age at onset between 60 and 75 years. LOD scores were also significantly increased on chromosome 15q22: a peak LOD score of 2.8 (P=.0004) was detected at D15S1507 (60 cM) in 38 families with minimum age at onset >/=79 years, and a peak LOD score of 3.1 (P=.0006) was obtained at D15S153 (62 cM) in 43 families with mean age at onset >80 years. Thirty-one families were contained in both 15q22 subsets, indicating that these results are likely detecting the same locus. There is little overlap in these subsets, underscoring the utility of age at onset as a marker of genetic heterogeneity. These results indicate that linkage to chromosome 9p is strongest in late-onset AD and that regions on chromosome 2q34 and 15q22 are linked to early-onset AD and very-late-onset AD, respectively.
Figures
Similar articles
-
Complete genomic screen in late-onset familial Alzheimer disease. Evidence for a new locus on chromosome 12.JAMA. 1997 Oct 15;278(15):1237-41. JAMA. 1997. PMID: 9333264
-
Fine mapping of the chromosome 12 late-onset Alzheimer disease locus: potential genetic and phenotypic heterogeneity.Am J Hum Genet. 2000 Mar;66(3):922-32. doi: 10.1086/302828. Am J Hum Genet. 2000. PMID: 10712207 Free PMC article.
-
Ordered subset linkage analysis supports a susceptibility locus for age-related macular degeneration on chromosome 16p12.BMC Genet. 2004 Jul 6;5:18. doi: 10.1186/1471-2156-5-18. BMC Genet. 2004. PMID: 15238159 Free PMC article.
-
Covariate analysis of late-onset Alzheimer disease refines the chromosome 12 locus.Mol Psychiatry. 2006 Mar;11(3):280-5. doi: 10.1038/sj.mp.4001766. Mol Psychiatry. 2006. PMID: 16222332
-
Ordered subset analysis supports a glaucoma locus at GLC1I on chromosome 15 in families with earlier adult age at diagnosis.Exp Eye Res. 2006 Jun;82(6):1068-74. doi: 10.1016/j.exer.2005.10.008. Epub 2005 Nov 18. Exp Eye Res. 2006. PMID: 16298363
Cited by
-
Evidence for a novel late-onset Alzheimer disease locus on chromosome 19p13.2.Am J Hum Genet. 2004 Sep;75(3):398-409. doi: 10.1086/423393. Epub 2004 Jul 8. Am J Hum Genet. 2004. PMID: 15248153 Free PMC article.
-
The genetics of Alzheimer's disease.Am J Alzheimers Dis Other Demen. 2007 Feb-Mar;22(1):37-41. doi: 10.1177/1533317506295655. Am J Alzheimers Dis Other Demen. 2007. PMID: 17534000 Free PMC article. Review.
-
Molecular genetics of Alzheimer's disease.Curr Psychiatry Rep. 2004 Apr;6(2):125-33. doi: 10.1007/s11920-004-0052-6. Curr Psychiatry Rep. 2004. PMID: 15038915 Review.
-
Apolipoprotein E levels in cerebrospinal fluid and the effects of ABCA1 polymorphisms.Mol Neurodegener. 2007 Apr 12;2:7. doi: 10.1186/1750-1326-2-7. Mol Neurodegener. 2007. PMID: 17430597 Free PMC article.
-
Lingo-1: a novel target in therapy for Alzheimer's disease?Neural Regen Res. 2016 Jan;11(1):88-9. doi: 10.4103/1673-5374.175048. Neural Regen Res. 2016. PMID: 26981092 Free PMC article. No abstract available.
References
Electronic-Database Information
-
- Center for Human Genetics, http://www.chg.duke.edu/software/osa.html (for OSA software)
-
- Ensembl, http://www.ensembl.org/
-
- Marshfield Medical Research Foundation, Center for Medical Genetics, http://www.marshfieldclinic.org/research/genetics/
-
- Online Mendelian Inheritance in Man (OMIM), http://www.ncbi.nlm.nih.gov/Omim/ (for AD) - PubMed
References
-
- Blacker D, Bertram L, Saunders AJ, Moscarillo TJ, Albert MS, Wiener H, Perry RT, Collins JS, Harrell LE, Go RC, Mahoney A, Beaty T, Fallin MD, Avramopoulos D, Chase GA, Folstein MF, McInnis MG, Bassett SS, Doheny KJ, Pugh EW, Tanzi RE (2003) Results of a high-resolution genome screen of 437 Alzheimer’s disease families. Hum Mol Genet 12:23–32 - PubMed
-
- Corder EH, Saunders AM, Risch NJ, Strittmatter WJ, Schmechel DE, Gaskell PC Jr, Rimmler JB, Locke PA, Conneally PM, Schmader KE, Small GW, Roses AD, Haines JL, Pericak-Vance MA (1994) Protective effect of apolipoprotein E type 2 allele for late onset Alzheimer disease. Nat Genet 7:180–184 - PubMed
Publication types
MeSH terms
Substances
Grants and funding
- R01 AG009029/AG/NIA NIH HHS/United States
- P50 AG005128/AG/NIA NIH HHS/United States
- MH59528/MH/NIMH NIH HHS/United States
- U24 AG021886/AG/NIA NIH HHS/United States
- U01 MH046373/MH/NIMH NIH HHS/United States
- MH52453/MH/NIMH NIH HHS/United States
- P30 AG010123/AG/NIA NIH HHS/United States
- AG05128/AG/NIA NIH HHS/United States
- R01 NS031153/NS/NINDS NIH HHS/United States
- R01 MH052453/MH/NIMH NIH HHS/United States
- P60 AG011268/AG/NIA NIH HHS/United States
- RR00856/RR/NCRR NIH HHS/United States
- U01 MH046290/MH/NIMH NIH HHS/United States
- NS31153/NS/NINDS NIH HHS/United States
- AG019726/AG/NIA NIH HHS/United States
- AG11268/AG/NIA NIH HHS/United States
- R01 MH059528/MH/NIMH NIH HHS/United States
- AG09029/AG/NIA NIH HHS/United States
- R01 AG019726/AG/NIA NIH HHS/United States
- U01 MH046281/MH/NIMH NIH HHS/United States
LinkOut - more resources
Full Text Sources
Other Literature Sources
Medical
