. 2003 Sep 19:2:32.
doi: 10.1186/1475-2875-2-32. Epub 2003 Sep 19.

Zooprophylaxis or zoopotentiation: the outcome of introducing animals on vector transmission is highly dependent on the mosquito mortality while searching

Affiliations

Zooprophylaxis or zoopotentiation: the outcome of introducing animals on vector transmission is highly dependent on the mosquito mortality while searching

Allan Saul. Malar J. .

Abstract

Background: Zooprophylaxis, the diversion of disease carrying insects from humans to animals, may reduce transmission of diseases such as malaria. However, as the number of animals increases, improved availability of blood meals may increase mosquito survival, thereby countering the impact of diverting feeds.

Methods: Computer simulation was used to examine the effects of animals on the transmission of human diseases by mosquitoes. Three scenarios were modelled: (1) endemic transmission, where the animals cannot be infected, eg. malaria; (2) epidemic transmission, where the animals cannot be infected but humans remain susceptible, e.g. malaria; (3) epidemic disease, where both humans and animals can be infected, but develop sterile immunity, eg. Japanese encephalitis B. For each, the passive impact of animals as well as the use of animals as bait to attract mosquitoes to insecticide was examined. The computer programmes are available from the author. A teaching model accompanies this article.

Results: For endemic and epidemic malaria with significant searching-associated vector mortality, changing animal numbers and accessibility had little impact. Changing the accessibility of the humans had a much greater effect. For diseases with an animal amplification cycle, the most critical factor was the proximity of the animals to the mosquito breeding sites.

Conclusion: Estimates of searching-associated vector mortality are essential before the effects of changing animal husbandry practices can be predicted. With realistic values of searching-associated vector mortality rates, zooprophylaxis may be ineffective. However, use of animals as bait to attract mosquitoes to insecticide is predicted to be a promising strategy.


Figures

Figure 1
Figure 1
Simulation of endemic malaria. The effect of altering numbers of animals on the human inoculation rate, the sporozoite rate, the vectorial capacity, and the number of mosquitoes ovipositing per day. Parameters used are shown in Table 2. Black line: Ms = 0 h-1; red line: Ms = 0.02 h-1; green line: Ms = 0.04 h-1; blue line: Ms = 0.08 h-1.
Figure 2
Figure 2
Simulation of endemic malaria with varying numbers of animals used as bait to attract mosquitoes to insecticide. Black line: Mf = 0; red line: Mf = 0.2; green line: Mf = 0.4; blue line: Mf = 0.6 (ie. a 0, 20, 40 or 60% chance of being killed as a result of feeding on animals respectively). Ms = 0.04 h-1, Pov = 0.72, N0 = 960. Other parameters are those used for Fig. 1 (Table 2). The black line (Mf = 0) is the same as the green line in Fig. 1.
Figure 3
Figure 3
Simulation of a malaria epidemic: effect of altering the number of animals. The parameters used are shown in Table 3. Black line: animal to human ratio of 1:8; red line: animal to human ratio of 1:4; green line: animal to human ratio of 1:2 (or an equivalent of 12.5, 25 and 50 animals respectively, for a village of 100 people).
Figure 4
Figure 4
Simulation of a malaria epidemic: effect of altering the accessibility of both humans and animals. Ratio of animals to humans 1: 4 used for each curve (25 animals and 100 humans). Black line: Aa = 0.002 h-1, Ah = 0.0005 h-1 (ie. both 0.5 times as accessible as the standard conditions); red line: Aa = 0.004 h-1, Ah = 0.001 h-1 (standard conditions); green line: Aa = 0.008 h-1, Ah = 0.002 h-1 (ie. both 2 times as accessible as the standard conditions). Other parameters were those used in Fig. 3 (Table 3).
Figure 5
Figure 5
Simulation of a malaria epidemic: use of animals to attract mosquitoes to insecticide. Black line: Mf = 0; red line: Mf = 0.1; green line: Mf = 0.2 (ie. a 0, 10, or 20% chance of being killed as a result of feeding on animals respectively). Ms = 0.04 h-1, Pov = 0.72, N0 = 960, Aa = 25. Other parameters are those used for Fig. 3 (Table 3). The black line is the same as the red line in Fig. 3 for Ms = 0.04 h-1.
Figure 6
Figure 6
Simulation of an arbovirus epidemic: effect of altering the number of animals. The parameters used are shown in Table 3. Black line: animal to human ratio of 1:8; red line: animal to human ratio of 1:4; green line: animal to human ratio of 1:2 (or an equivalent of 12.5, 25 and 50 animals respectively, for a village of 100 people).
Figure 7
Figure 7
Simulation of an arbovirus epidemic: effect of altering theaccessibility (attractive rate constant) of animals. The parameters used are shown in Table 3. Black line: Aa 0.002 h-1; red line: Aa 0.004 h-1 (standard conditions: red lines in Fig. 6); green line: Aa 0.008 h-1.
Figure 8
Figure 8
Simulation of an arbovirus epidemic: effect of altering the accessibility of both humans and animals. Ratio of animals to humans 1: 4 used for each curve (25 animals and 100 humans). Black line: Aa = 0.002 h-1, Ah = 0.0005 h-1 (ie. both 0.5 times as accessible as the standard conditions); red line: Aa = 0.004 h-1, Ah = 0.001 h-1 (standard conditions); green line: Aa = 0.008 h-1, Ah = 0.002 h-1 (ie. both 2 times as accessible as the standard conditions). Other parameters were those used in Fig. 6 (Table 3).
Figure 9
Figure 9
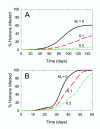
Simulation of an arbovirus epidemic: use of animals to attract mosquitoes to insecticide. Black line: Mf = 0; red line: Mf = 0.1; green line: Mf = 0.2 (ie. a 0, 10, or 20% chance of being killed as a result of feeding on animals respectively). Ms = 0.04 h-1, Pm = 0.72, Aa = 25. Top graph (A): N0 = 96; lower graph (B): N0 = 960. Other parameters are those used for Fig. 6 (Table 3). In Fig. 9A, the black line is the same as the red line in Figs. 6 and 7 for Ms = 0.04 h-1.

References

    1. Macdonald G. The epidemiology and control of malaria. London: Oxford University Press; 1957.
    1. Service MW. Mosquito ecology: Field sampling Methods. London: Applied Science Publishers; 1976.
    1. WHO Manual on environmental management for mosquito control with special emphasis on mosquito vectors WHO offset publication No 66 Geneva, Sw: WHO. 1982. - PubMed
    1. Ault SK. Environmental management: a re-emerging vector control strategy. Am J Trop MedHyg. 1994;50:35–49. - PubMed
    1. Bruce-Chwatt LJ. Essential Malariology. second. London: Heinemann; 1985.

Publication types

MeSH terms