. 2004 Jan;15(1):132-41.
doi: 10.1091/mbc.e03-04-0215. Epub 2003 Oct 17.

Lipid-dependent bidirectional traffic of apolipoprotein B in polarized enterocytes

Affiliations

Lipid-dependent bidirectional traffic of apolipoprotein B in polarized enterocytes

Etienne Morel et al. Mol Biol Cell. 2004 Jan.

Abstract

Enterocytes are highly polarized cells that transfer nutrients across the intestinal epithelium from the apical to the basolateral pole. Apolipoprotein B (apoB) is a secretory protein that plays a key role in the transepithelial transport of dietary fatty acids as triacylglycerol. The evaluation of the control of apoB traffic by lipids is therefore of particular interest. To get a dynamic insight into this process, we used the enterocytic Caco-2 cells cultured on microporous filters, a system in which the apical and basal compartments can be delimited. Combining biochemical and morphological approaches, our results showed that, besides their role in protection from degradation, lipids control the intracellular traffic of apoB in enterocytes. A supply of fatty acids and cholesterol is sufficient for the export of apoB from the endoplasmic reticulum and its post-Golgi traffic up to the apical brush-border domain, where it remains until an apical supply of complex lipid micelles signals its chase down to the basolateral secretory domain. This downward traffic of apoB involves a microtubule-dependent process. Our results demonstrate an enterocyte-specific bidirectional process for the lipid-dependent traffic of a secretory protein.


Figures

Figure 1.
Figure 1.
Apical localization of apoB in Caco-2 cells. (A) Immunolocalization of apolipoprotein B (apoB, red channel) and sucrase-isomaltase (SI, green channel) in differentiated Caco-2 cells cultured on filters; top panels represent XY acquisitions at the apical level. Bottom panels show the corresponding XZ projections (bar, 20 μm). (B) Immunolocalization of apoB (red channel) and SI (green channel) on transverse cryosections of Caco-2 cells cultured as in A. Bar, 10 μm. (C) Immunolocalization of apoB (red channel) and phalloidin-FITC labeling of the F-actin network (green channel): top panels represent XY acquisitions at the apical level, and bottom panels show the corresponding XZ projections. Bar, 10 μm. (D) Immunolocalization of apoB (red channel) and ZO1 (green channel); top panels represent XY acquisition at the tight junctions (Tj) plane. Bottom panels show the corresponding XZ projections. Bar, 10 μm. (E) Immunoelectron microscopy analysis of apoB in the BBD of Caco-2 cells. Bar, 1 μm. (F) Schematic representation of the distribution of apoB with respect to markers.
Figure 2.
Figure 2.
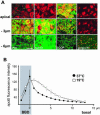
Characterization of apoB-containing subcellular compartments in Caco-2 cells. (A) Immunolocalization of apoB (red channel) at the apex, and 3 μm and 6 μm below the apical plane in Caco-2 cells, compared with that for PDI (endoplasmic reticulum), sec13 (COPII vesicles), β-Cop (COPI vesicles), and Golgin 97 (trans-Golgi) (green channels). Bar, 10 μm. (B) Effect of temperature on the distribution of apoB; cells were cultured at 37°C or 19°C for 3 h. The localization of apoB was determined by confocal microscopy with respect to the apical domain (BBD, gray area), which was labeled with nonpermeant reactive biotin (sulfo-NHS-Biotin) detected with tetramethylrhodamine B isothiocyanate-conjugated streptavidin. For each area that was analyzed, point zero corresponds to the maximal intensity of the biotin labeling of the brush-border membrane (dashed line). The graphs represent the intensity of apoB-associated fluorescence that was evaluated for 12 areas composed of nine to 11 cells at 1-μm intervals along the Z-axis in the BBD and from point 0 to the basal part of the cells.
Figure 3.
Figure 3.
Apical localization of apoB depends on lipid supply. (A) apoB-SI colocalization, as a function of basal lipid supply. In the basal compartment, ITS was used alone or supplemented with oleic acid (OA), cholesterol (Chol), or a mixture of OA, cholesterol, and palmitic acid (ITS/L). Confocal microscopy was used to study the colocalization of SI and apoB in each of these conditions. Results are expressed as the percentage of cells in which apoB and SI colocalized, with the value for cells incubated with FCS-supplemented medium set at 100%. Insets display XY acquisitions of the apoB signal in the apical region of cells cultured with ITS medium alone (ITS) or supplemented with lipids (ITS/L). (B) Immunolocalization of apoB (red channel), SI (blue channel), PDI (green channel on left panel), or Golgin 97 (green channel on right panel) at the apex, and at –3 and –6 μm with respect to the apical plane and in XZ representations in Caco-2 cells cultured in ITS medium. Dotted lines delimit the brush-border domain and the basal level of Caco-2 cells. Bar, 10 μm.
Figure 4.
Figure 4.
apoB stability and MTP subcellular distribution in the different culture conditions. (A) Western blot analysis of apoB distribution in Caco-2 cells cultured with ITS, ITS/L, or FCS-containing medium in the basal compartment. Forty micrograms of proteins was loaded in each lane. (B) Pulse-chase experiments of apoB in Caco-2 cells cultured with ITS or FCS-containing medium in the basal compartment. After 1 h of labeling with [35S]Met/Cys (0) and at 1 and 3 h of chase, apoB was immunoprecipitated from cell extracts (200 μg of proteins for each condition) and media (250 μl in each condition), electrophoresed, analyzed by fluorography, and counted. Results, from four independent determinations, are expressed as the percentage of labeled apoB recovered in cells and media compared with the 100% amount of labeled apoB at t = 0 of chase, i.e., 18,000 ± 1,700 and 16,500 ± 1,300 cpm/mg proteins in ITS and FCS conditions respectively. (C) Confocal analysis of MTP cellular distribution in ITS, ITS/L, and FCS culture conditions. Top, comparison of MTP signal (red channel) and FITC-WGA staining of BBD, Golgi apparatus, and endosomal compartments (green channel) at the apex, and 3 and 6 μm below the apical plane and in XZ representation. Dotted lines delimit the brush-border domain and the basal level of Caco-2 cells. Bottom, immunolocalization of MTP (red channel) and PDI (green channel) at 3 μm below the apical plane. Bars, 20 μm.
Figure 5.
Figure 5.
FA incorporation and TAG traffic after the apical application of micelles. Complex lipid micelles were applied apically to Caco-2 cells. (A) micelles contained Bodipy-labeled fatty acids. Bodipy-associated fluorescence was monitored at the apical plane and at 3 and 6 μm below this plane. Cells treated with nocodazole (ncdzl) during the period of incubation with micelles were analyzed after 60 min (bottom). Bar, 50 μm. (B) Accumulation of TAG as assessed by Nile-Red yellow fluorescence after the apical delivery of micelles (red color corresponds to phospholipids). Bar, 50 μm. Note that the kinetics of intracellular traffic were similar for FAs incorporated from micelles and Nile Red stained-TAG. (C) Transmission electron microscopy analysis of lipids localization in Caco-2 cells, 15 min after micelles application. Arrows indicate the presence of lipid droplets in the subapical compartment within the ER (stars). Note that the BBD is devoid of lipid droplets. Bars, 1 μm.
Figure 6.
Figure 6.
apoB traffic after the apical application of micelles. (A) apoB immunolocalization at the apex and 6 μm below the apex, 30 and 60 min after the addition of lipid micelles; the inset in the bottom panel represents an XZ projection of the XY acquisitions 60 min after micelle delivery. (B) apoB immunolocalization 6 μm below the apex 60 min after micelles delivery in the presence of nocodazole (ncdzl). (C) apoB immunolocalization 6 μm below the apex 60 min after the addition of BSA-complexed oleic acid (OA-BSA). Bars, 50 μm; for inset in A, 10 μm. (D) Western blot analysis of apoB distribution in Caco-2 cells cultured with FCS-containing medium in the basal compartment in the presence (+) or the absence (–) of apical micelles supply. Forty micrograms of proteins were loaded in each lane. (E) Pulse-chase experiments of apoB in Caco-2 cells cultured with FCS-containing medium in the basal compartment in the presence or absence of apical micelles supply. After 1 h of labeling with [35S]Met/Cys (0) and at 1 and 3 h of chase, apoB was immunoprecipitated from cell extracts (200 μg of proteins for each condition) and media (250 μl in each condition), electrophoresed, analyzed by fluorography, and counted. Results, from four independent determinations, are expressed as the percentage of labeled apoB recovered in cells and media compared with the 100% amount of labeled apoB at t = 0 of chase, i.e., 15,700 ± 850 and 16,500 ± 1,300 cpm/mg proteins in the presence or absence of apical micelles supply respectively. (F) Immunolocalization of apoB (red channel) and Golgin 97 (green channel) 6 μm below the apical plane in Caco-2 cells without (top) or with lipids micelles in the medium for 30 min (bottom). Bar, 10 μm. (G) XZ representations of apoB (red channel) and SI (green channel) immunolocalization in Caco-2 cells treated with CHX without (top) or with (bottom) incubation with lipids micelles for 30 min. Dotted lines delimit the brush-border domain and the basal level of Caco-2 cells in the XZ representation. White arrowheads indicate delocalized apoB. Bar, 20 μm. Note that the apical application of micelles specifically induced rapid vesicular traffic of apoB from apical to lateral perinuclear areas.
Figure 7.
Figure 7.
The delivery of micelles to Caco-2 cells cultured in ITS medium induces the export of apoB from the ER and the completion of its traffic. (A) Immunolocalization of apoB (red channel), SI (blue channel) and PDI (green channel), at 3 μm and 6 μm below the apical plane and in an XZ representation of Caco-2 cells cultured in ITS medium before (ITS control) and after 30 and 60 min of incubation with micelles. Dotted lines delimit the brush-border domain and the basal level of Caco-2 cells in the XZ representation. Bars, 10 μm. (B) Pulse-chase experiments of apoB in Caco-2 cells cultured with ITS-containing medium in the basal compartment in the presence or absence of apical micelles supply. After 1 h labeling with [35S]Met/Cys (0) and at 1 and 3 h of chase, apoB was immunoprecipitated from cell extracts (200 μg of proteins for each condition) and media (250 μl in each condition), electrophoresed, analyzed by fluorography, and counted. Results, from four independent determinations, are expressed as the percentage of labeled apoB recovered in cells and media compared with the 100% amount of labeled apoB at t = 0 of chase, i.e., 16,500 ± 900 and 18,000 ± 1,700 cpm/mg proteins in the presence or the absence of apical micelles supply, respectively.
Figure 8.
Figure 8.
Dynamics of the traffic of the BBD-associated pool of apoB after the delivery of micelles. The colocalization of SI and apoB was analyzed by confocal microscopy 15, 30, and 60 min after the apical application of micelles to cells previously cultured without (ITS) or with (ITS/L) lipids in the basal compartment. Results are expressed as the percentage of cells in which SI and apoB colocalized, the value for ITS/L condition at time 0 being set at 100%. Results are the means for 3 fields of 4 × 104 μm2 from 2 independent cultures. The curves with dashed lines indicate intracellular apoB traffic. Note that in cells previously cultured in the absence of lipids (ITS), the application of micelles induced the apical targeting of apoB (up) before its chase (down).

Similar articles

Cited by

References

    1. Abumrad, N., Coburn, C., and Ibrahimi, A. (1999). Membrane proteins implicated in long-chain fatty acid uptake by mammalian cells: CD36, FATP and FABPm. Biochim. Biophys. Acta 1441, 4–13. - PubMed
    1. Alexander, C.A., Hamilton, R.L., and Havel, R.J. (1976). Subcellular localization of B apoprotein of plasma lipoproteins in rat liver. J. Cell Biol. 69, 241–263. - PMC - PubMed
    1. Boren, J., Rustaeus, S., and Olofsson, S.O. (1994). Studies on the assembly of apolipoprotein B-100- and B-48-containing very low density lipoproteins in McA-RH7777 cells. J. Biol. Chem. 269, 25879–25888. - PubMed
    1. Bostrom, K., Boren, J., Wettesten, M., Sjoberg, A., Bondjers, G., Wiklund, O., Carlsson, P., and Olofsson, S.O. (1988). Studies on the assembly of apo B-100-containing lipoproteins in HepG2 cells. J. Biol. Chem. 263, 4434–4442. - PubMed
    1. Carpentier, A., Taghibiglou, C., Leung, N., Szeto, L., Van Iderstine, S.C., Uffelman, K.D., Buckingham, R., Adeli, K., and Lewis, G.F. (2002). Ameliorated hepatic insulin resistance is associated with normalization of microsomal triglyceride transfer protein expression and reduction in very low density lipoprotein assembly and secretion in the fructose-fed hamster. J. Biol. Chem. 277, 28795–28802. - PubMed

Publication types