. 2003 Oct 28;42(42):12298-310.
doi: 10.1021/bi034998x.

An uncleavable procaspase-3 mutant has a lower catalytic efficiency but an active site similar to that of mature caspase-3

Affiliations

An uncleavable procaspase-3 mutant has a lower catalytic efficiency but an active site similar to that of mature caspase-3

Kakoli Bose et al. Biochemistry. .

Abstract

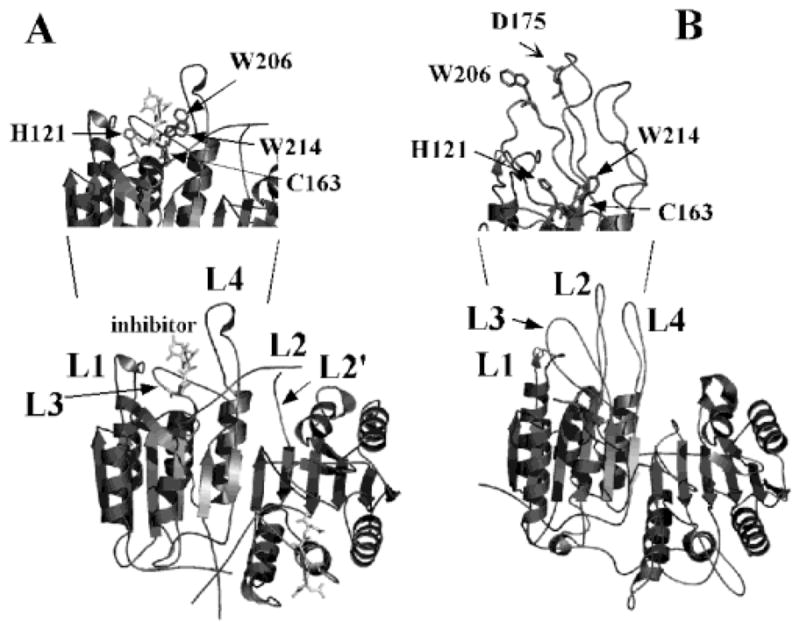
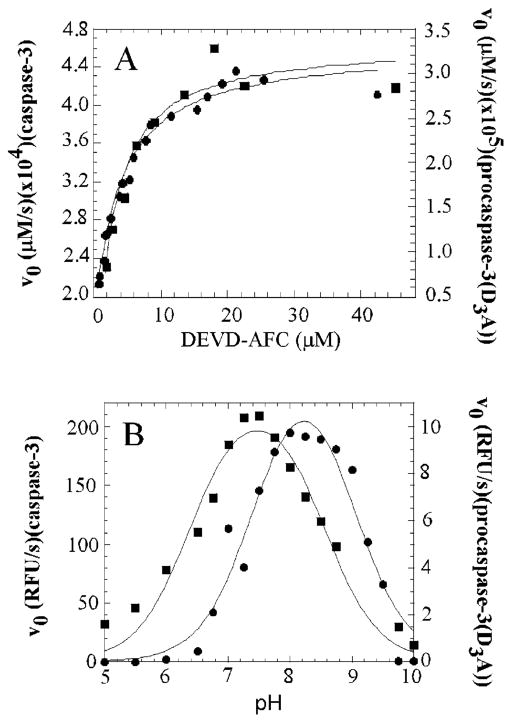
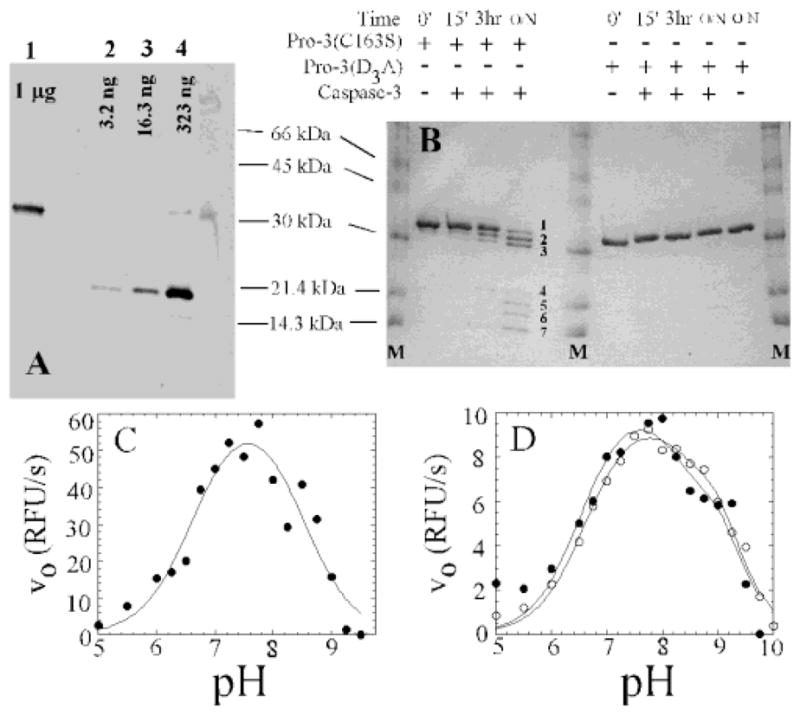
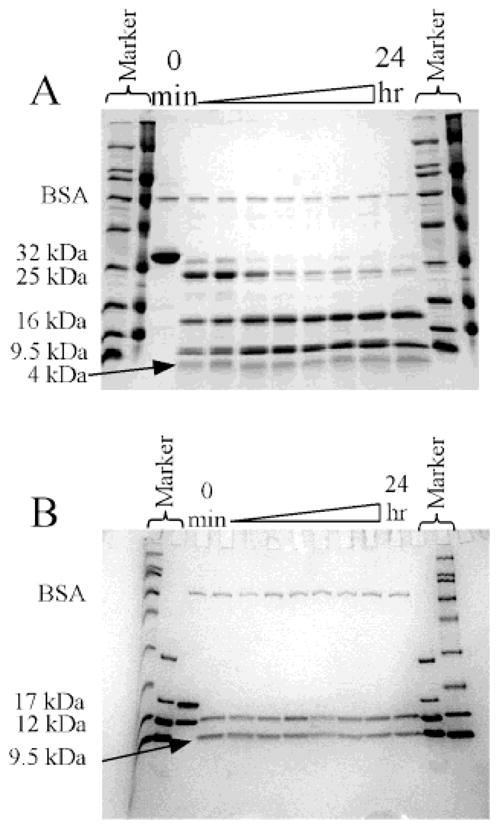
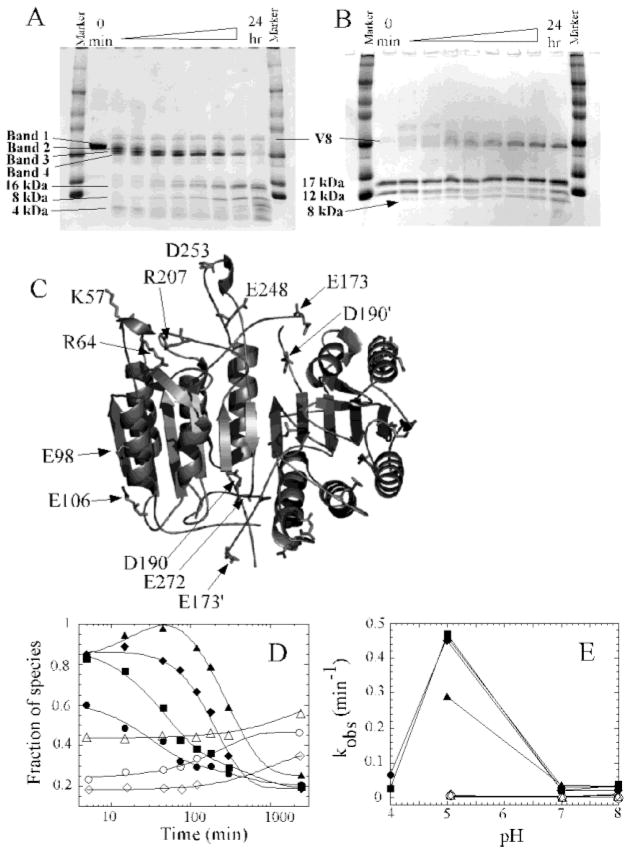
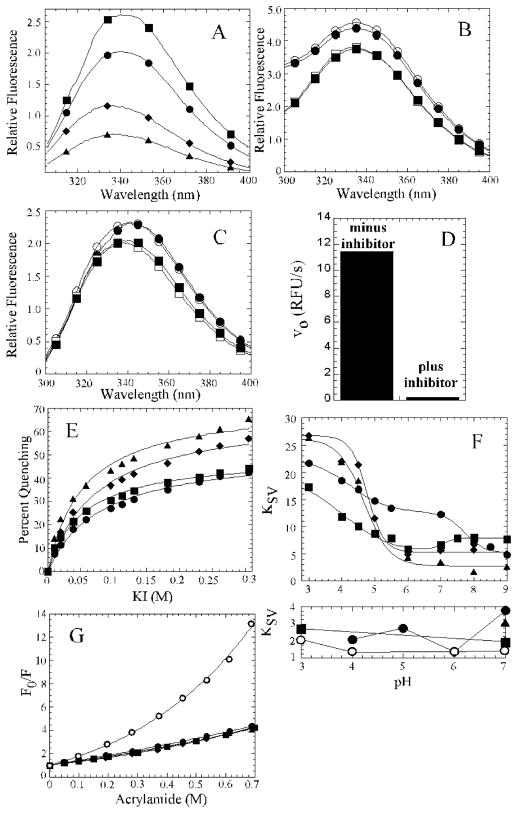
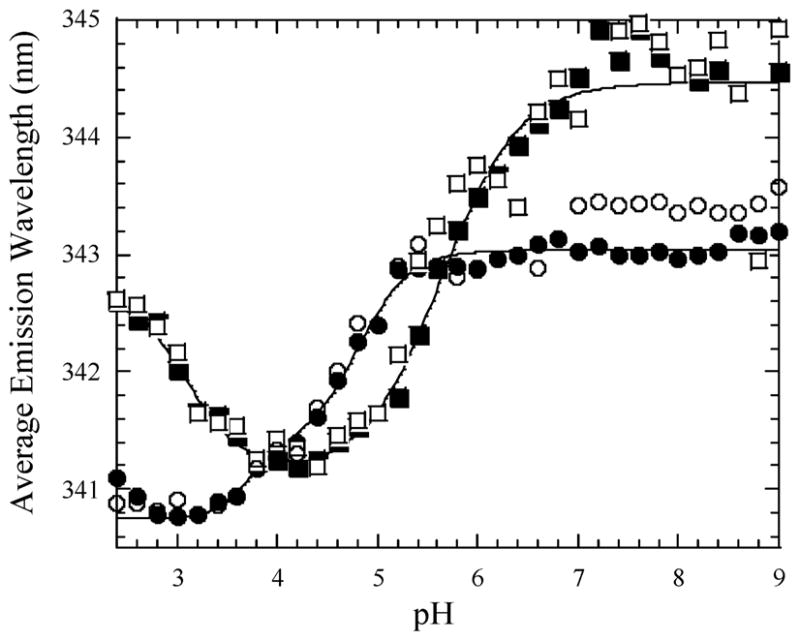
We have examined the enzymatic activity of an uncleavable procaspase-3 mutant (D9A/D28A/D175A), which contains the wild-type catalytic residues in the active site. The results are compared to those for the mature caspase-3. Although at pH 7.5 and 25 degrees C the K(m) values are similar, the catalytic efficiency (k(cat)) is approximately 130-fold lower in the zymogen. The mature caspase-3 demonstrates a maximum activity at pH 7.4, whereas the maximum activity of procaspase-3 occurs at pH 8.3. The pK(a) values of both catalytic groups, H121 and C163, are shifted to higher pH for procaspase-3. We developed limited proteolysis assays using trypsin and V8 proteases, and we show that these assays allow the examination of amino acids in three of five active site loops. In addition, we examined the fluorescence emission of the two tryptophanyl residues in the active site over the pH range of 2.5-9 as well as the response to several quenching agents. Overall, the data suggest that the major conformational change that occurs upon maturation results in formation of the loop bundle among loops L4, L2, and L2'. The pK(a) values of both catalytic groups decrease as a result of the loop movements. However, loop L3, which comprises the bulk of the substrate binding pocket, does not appear to be unraveled and solvent-exposed, even at lower pH.


Figures

Figure 1
Figure 1
Mature caspase-3 (inhibitor bound) structure (PDB entry 1CP3) (A) and procaspase-7 structure (PDB entry 1GQF) (B) generated with PyMOL (Delano Scientific). For panels A and B, L1 (residues 52–64), L2 (residues 163–175), L2′ (residues 176′–192′), L3 (residues 198–213), and L4 (residues 246–263) represent the five active site loops as described in the text. The prime indicates residues from the second heterodimer. The two tryptophan residues (W206 and W214), the cleavage site aspartate residue (D175), and the two catalytic residues (H121 and C163) are highlighted in the inset (caspase-3 numbering). For clarity, only one active site is labeled for the two proteins.
Figure 2
Figure 2
(A) Plot of initial velocity (v0) vs substrate concentration for procaspase-3(D3A) (●) and mature caspase-3 (■) at pH 7.5. Concentrations of procaspase-3(D3A) and mature caspase-3 were 10 and 1 nM, respectively. (B) Effect of pH on initial velocity (v0) for procaspase-3(D3A) (●) and mature caspase-3 (■). The solid lines represent fits to the Michaelis–Menten equation for panel A and to eq 1 for panel B as described in Materials and Methods. The parameters for the fits for panels A and B are shown in Table 1.
Figure 3
Figure 3
Characterization of procaspase-3(D3A). (A) Anti-caspase-3 immunoblot of procaspase-3(D3A) (lane 1) and of mature caspase-3 (lanes 2–4). Protein concentrations are indicated above each lane, and sizes of molecular mass markers are indicated. (B) Procaspase-3(C163S) or procaspase-3(D3A) incubated with mature caspase-3. M refers to molecular mass markers. The lines indicate the sizes of each marker. Bands 1–7 are described in the text. (C) Activity (v0) of mature caspase-3 (50 pM) vs pH. The solid line represents a fit of the data to eq 1 as described in Materials and Methods. The parameters obtained rom the fits are as follows: pKa1 = 6.6 and pKa2 = 8.5. The optimal pH range was 7.2–7.8. (D) Activity (v0) of a mixture of procaspase-3(D3A) (10 nM) and mature caspase-3 (50 pM) vs pH (●). The two individual experiments from Figure 2B were scaled and added and are shown for comparison (○). The solid lines represent fits to a modified form of eq 1 representing two independent enzyme activities.
Figure 4
Figure 4
(A) Trypsin digestion of procaspase-3(C163S) at pH 7.2. The 32 kDa band represents the full-length procaspase-3(C163S), whereas the 25, 16, 9.5, and 4 kDa bands are the cleavage products as described in the text. (B) Trypsin digestion of mature caspase-3 at pH 7.2. The 17 and 12 kDa bands represent the large and small subunits, respectively. The 9.5 kDa band represents the cleavage product as described in the text. A known amount of BSA was added for normalization.
Figure 5
Figure 5
(A) V8 protease (Endo-Glu C) digests of procaspase-3(C163S) at pH 7.0. (B) V8 protease digests of mature caspase-3 at pH 7.0. (C) Trypsin and V8 protease cleavage sites of procaspase-3(C163S) are mapped onto the caspase-3 structure. The structure was generated using the program PyMOL (Delano Scientific). The cleavages at K57, R64, and R207 are by trypsin, and the cleavages at E98, E106, E173, D190, E248, D253, and E272 are by V8 protease. The prime indicates residues from the second heterodimer. Note that the inhibitor has been removed and only half of the protein is labeled for clarity. (D) Fraction of species vs time for procaspase-3(C163S) at pH 7.0. (E) Plot of kobs vs pH for the procaspase-3(C163S) fragments. In panels D and E, the bands are shown as follows: band 1 (●), band 2 (■), band 3 (◆), band 4 (▲), 16 kDa band (○), 8 kDa band (◇), and 4 kDa band (△). Solid lines in panel D represent fits of the data as described in Materials and Methods. Bands 1–4 were fit to a double-exponential equation, while the 16, 8, and 4 kDa bands were fit to a single-exponential equation. The rates of disappearance (kobs) of bands 1–4 and the rates of formation (kobs) of the 16, 8, and 4 kDa bands from the fits were plotted vs pH as shown in panel E. The points in panel E were joined by solid lines.
Figure 6
Figure 6
(A) Fluorescence emission scans of procaspase-3(C163S) (●), mature caspase-3 (■), procaspase-3(C163A/W206Y) (▲), and procaspase-3(C163A/W214V) (◆). Samples were excited at 295 nm, and emission was monitored between 305 and 400 nm. (B and C) Fluorescence emission scans of procaspase-3(C163S) (○ and ●) or procaspase-3(D3A) (□ and ■) in the absence (empty symbols) or presence (filled symbols) of the inhibitor (Z-VAD-FMK). Samples were excited at 280 (B) or 295 nm (C). (D) Activity (v0) of procaspase-3(D3A) before or after inhibition with Z-VAD-FMK. Procaspase-3(D3A) (0.5 μM) was incubated with Z-VAD-FMK (5 μM) in assay buffer (pH 7.8), and the enzymatic activity was determined as described in Materials and Methods. (E) Plot of percent quenching by iodide vs pH for procaspase-3(C163S) at pH 7.0 (●), 6.0 (■), 5.0 (◆), and 4.0 (▲). (F) In top panel are shown Stern–Volmer quenching constants (KSV) for quenching by iodide vs pH for procaspase-3(C163S) (●), procaspase-3(C163A/W206Y) (▲), procaspase-3(C163A/W214V) (◆), and mature caspase-3 (■). In the bottom panel are shown Stern–Volmer quenching constants (KSV) for quenching by acrylamide vs pH for procaspase-3(C163S) (●), procaspase-3(C163A/W206Y) (▲), and mature caspase-3 (■) and Stern–Volmer quenching constants (KSV) for quenching by CsCl vs pH for procaspase-3(C163S) (○). (G) Acrylamide quenching of procaspase-3(C163S) (●), procaspase-3(C163A/W206Y) (▲), procaspase-3(C163A/W214V) (◆), mature caspase-3 (■), and procaspase-3(C163S) in buffer containing 8 M urea (○) at pH 7. Data were fit to eqs 2 and 3 for panels E and F (top panel), respectively. For panel G, the data were fit to the Stern–Volmer equation that accounts for dynamic and static quenching as described in the text.
Figure 7
Figure 7
Average emission wavelength (〈λ〉) vs pH for procaspase-3(C163S) (● and ○) and mature caspase-3 (■ and □). Filled symbols represent titrations from pH 9 to 2.4, and empty symbols represent titrations from pH 2.4 to 9. Solid lines represent fits of the data to eq 5 as described in Materials and Methods. The parameters obtained from the fits are described in the text.

References

    1. Earnshaw WC, Martins LM, Kaufmann SH. Annu Rev Biochem. 1999;68:383–424. - PubMed
    1. Stennicke HR, Salvesen GS. Biochim Biophys Acta. 1998;1387:17–31. - PubMed
    1. Kumar S. Clin Exp Pharmacol Physiol. 1999;26:295–303. - PubMed
    1. Garcia-Calvo M, Peterson EP, Villiancourt JP, Zamboni R, Nicholson DW, Thornberry NA. Cell Death Differ. 1999;6:362–369. - PubMed
    1. Thornberry NA, Rano TA, Peterson EP, Rasper DM, Timkey T, Carcia-Calvo M, Hotzager VM, Nordstrom PA, Roy S, Vaillancourt JP, Chapman KT, Nicholson DW. J Biol Chem. 1997;272:17907–17911. - PubMed

Publication types