Comparative Study
. 2003 Oct 20;198(8):1201-12.
doi: 10.1084/jem.20030305.

Human decidual natural killer cells are a unique NK cell subset with immunomodulatory potential

Affiliations
Comparative Study

Human decidual natural killer cells are a unique NK cell subset with immunomodulatory potential

Louise A Koopman et al. J Exp Med. .

Abstract

Natural killer cells constitute 50-90% of lymphocytes in human uterine decidua in early pregnancy. Here, CD56(bright) uterine decidual NK (dNK) cells were compared with the CD56(bright) and CD56(dim) peripheral NK cell subsets by microarray analysis, with verification of results by flow cytometry and RT-PCR. Among the approximately 10,000 genes studied, 278 genes showed at least a threefold change with P < or = 0.001 when comparing the dNK and peripheral NK cell subsets, most displaying increased expression in dNK cells. The largest number of these encoded surface proteins, including the unusual lectinlike receptors NKG2E and Ly-49L, several killer cell Ig-like receptors, the integrin subunits alpha(D), alpha(X), beta1, and beta5, and multiple tetraspanins (CD9, CD151, CD53, CD63, and TSPAN-5). Additionally, two secreted proteins, galectin-1 and progestagen-associated protein 14, known to have immunomodulatory functions, were selectively expressed in dNK cells.


Figures
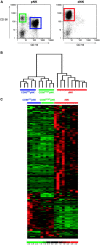
Figure 1.
Figure 1.
dNK CD56bright, pNK CD56bright, and pNK CD56dim cells represent three different NK cell subsets. (A) Typical gates used for flow sorting dNK (red), pNK CD56bright CD16- (green), and CD56dim CD16- (blue) NK cell subsets. Decidual and peripheral lymphocyte suspensions were triple stained with directly conjugated mAbs reactive with CD3, CD16, and CD56. Lymphocytes were first gated by forward scatter/side scatter characteristics. After setting a gate on CD3 negative cells (NK-enriched peripheral blood preparations were typically already >99% CD3-negative), cells were sorted on the basis of CD56 and CD16 expression. (B) Unsupervised hierarchical clustering of 19 freshly sorted NK cell samples based on the expression profile of genes with variable expression levels across all samples. The organization and length of the branches in the resulting dendrogram reflect the similarity in gene expression profiles between each of the samples. No correlation between gestational age (range, 6–12 wk) and clustering pattern was observed. (C) Relative intensity profiles of 278 genes differentially expressed with at least a threefold change at P ≤ 0.001 in at least one of the three comparisons (dNK vs. CD56bright pNK; dNK vs. CD56dim pNK; CD56bright vs. CD56dim pNK). Each row represents relative hybridization intensities of a particular gene across different samples. Each column represents one sample. Colors reflect the magnitude of relative expression of a particular gene across samples. Brighter red means higher expression, brighter green means lower expression, and black means average intensity across samples.
Figure 2.
Figure 2.
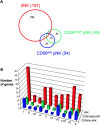
The majority of differentially expressed genes are up-regulated in dNK cells. (A) Venn diagram generated by the intersection of the list of genes up-regulated by each NK cell subset. Genes were considered to be overexpressed in a particular NK cell subset if they showed higher expression relative to at least one of the other subsets in the pairwise Student's t test comparisons at P ≤ 0.001. For example, a total of 197 genes are overexpressed in dNK versus at least one of the two pNK subsets, 188 of which were overexpressed in dNK only. Only 2 of the 197 genes are overexpressed in both dNK and CD56bright pNK cells versus CD56dim pNK cells (intersection of red and green), and 7 of the 197 genes are overexpressed in dNK and CD56dim pNK cells versus CD56bright pNK cells (intersection of red and blue). (B) Distribution by functional category of genes with significant up-regulation in each NK cell type. I, surface molecules/receptors/adhesion; II, chemokines/cytokines/immunomodulatory and other secreted proteins; III, immune effector molecules and apoptosis related; IV, signal transduction related; V, cytoskeleton related; VI, cell cycle + stress; VII, DNA binding/transcription/translation; VIII, metabolism; IX, other genes; and X, genes with unknown function.
Figure 3.
Figure 3.
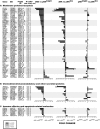
Differentially expressed genes in dNK and pNK cells. Fold changes of genes that showed greater than or equal to threefold change. P ≤ 0.001 (black bars) in at least one of the three pairwise comparisons: dNK versus pNKbright (left diagrams); dNK versus pNKdim (middle diagrams); and pNKbright versus pNKdim (right diagrams) are presented. The 278 transcripts that met these criteria were classified into the following 10 categories: I, surface molecules/receptors/adhesion (A, 58 genes); II, chemokines/cytokines/immunomodulatory and other secreted proteins (B, 12 genes); III, immune effector molecules and apoptosis related (C, 7 genes); IV, signal transduction related (32 genes); V, cytoskeleton related (26 genes); VI, cell cycle + stress (15 genes); VII, DNA- binding/transcription/translation (33 genes); VIII, metabolism (23 genes); IX, other genes (40 genes); and X, genes with unknown function (33 genes). The first three categories are shown in this figure (A–C); data for the remaining categories are shown as Fig. S1. Black and gray bars represent fold changes in pairwise comparisons with significance levels ≥0.001 and ≤0.05, respectively. White bars represent statistically nonsignificant changes. Gene, gene name, or gene symbol obtained from Locuslink or Netaffx (Affymetrix, Inc.). GB, GenBank accession number. Probe ID, Affymetrix probeset designation. P-(Presence) calls (dNK, bright, and dim), number of present calls by Affymetrix algorithms in nine dNK, five pNK CD56bright, and five CD56dim NK cells, respectively.
Figure 4.
Figure 4.
Verification of selected surface expressed molecules by flow cytometry. To compare protein expression on the different NK cell populations (gated as in Fig. 1 A), triple or quadruple [CD56 + CD16 + (CD3) + (marker of interest) on NK-enriched peripheral blood preparations; CD56 + CD3 + (CD16) + (marker of interest) on decidual samples] staining was performed. Histogram overlays (representative of at least five experiments) demonstrating the expression of various markers are shown together with genechip hybridization intensity data (bars) for the probeset of the corresponding gene. Gray and black histograms represent the isotype controls for pNK and dNK cells, respectively. Lines and bars are color-coded for dNK (red), CD56bright pNK (green), and CD56dim pNK cells (blue). Numbers on bars represent number of “present” calls (according to Affymetrix, Inc. algorithms) per number of samples hybridized. CD56 (a), CD16 (b), CD9 (c), CD151(d), KIR2DL3* (e), KIR3DL1** (f), and KIR2DL4 (g) were among the list of 278 differentially expressed genes fitting the stringent criteria (threefold change and P ≤ 0.001 in any of the comparisons). *KIR2DL3 was verified with mAb CD158b, (reactive besides KIR2DL3, with KIR2DS3 and KIR2DL2/S2 that were not represented on the chip) **KIR3DL1 was verified with mAb NKB1 (also reactive with KIR3DS1). CD62L (h), shown as an example of a gene differentially expressed in CD56bright pNK cells (17), was differentially expressed resulting from pairwise Student's t test comparisons at P < 0.01, but did not fit the more stringent criteria of threefold change and P < 0.001. Levels of significance per comparison are indicated. NS, not significant.
Figure 5.
Figure 5.
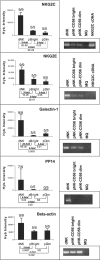
Confirmation of transcript expression by RT-PCR analysis. RT-PCR was performed on total RNA isolated from human dNK, CD56dim, and CD56bright pNK cells. Results shown are representative of three different samples for each of these NK cell types (right). Genechip hybridization data for the 19 samples and statistical significance levels of pairwise comparisons are presented (left). Numbers on bars represent number of present calls (according to Affymetrix, Inc. algorithms) per number of samples hybridized to genechips. Fold changes and levels of significance per comparison are indicated. NS, not significant. Specific transcripts for NKG2C, NKG2E, galectin-1, and PP14 were detected in dNK cell samples by RT-PCR, whereas their presence appeared to be relatively less (or absent in the case of PP14) in both pNK cells subsets. In the genechip experiments, these transcripts were found to be overexpressed in dNK cells with fold differences, 3- to 9-fold (NKG2s and PP14) and 6- to 20-fold (galectin-1). MQ, Millipore Q water.

References

    1. Billingham, R.E., L. Brent, and P.B. Medawar. 1953. Actively acquired tolerance of foreign cells. Nature. 172:603–606. - PubMed
    1. Pearson, H. 2002. Reproductive immunology: immunity's pregnant pause. Nature. 420:265–266. - PubMed
    1. Moffett-King, A. 2002. Natural killer cells and pregnancy. Nat. Rev. Immunol. 2:656–663. - PubMed
    1. Cooper, M.A., T.A. Fehniger, and M.A. Caligiuri. 2001. The biology of human natural killer-cell subsets. Trends Immunol. 22:633–640. - PubMed
    1. Faulk, W.P., and A. Temple. 1976. Distribution of beta2 microglobulin and HLA in chorionic villi of human placentae. Nature. 262:799–802. - PubMed

Publication types