. 2003 Oct 27;163(2):283-93.
doi: 10.1083/jcb.200301084. Epub 2003 Oct 20.

Herpes simplex virus triggers activation of calcium-signaling pathways

Affiliations

Herpes simplex virus triggers activation of calcium-signaling pathways

Natalia Cheshenko et al. J Cell Biol. .

Abstract

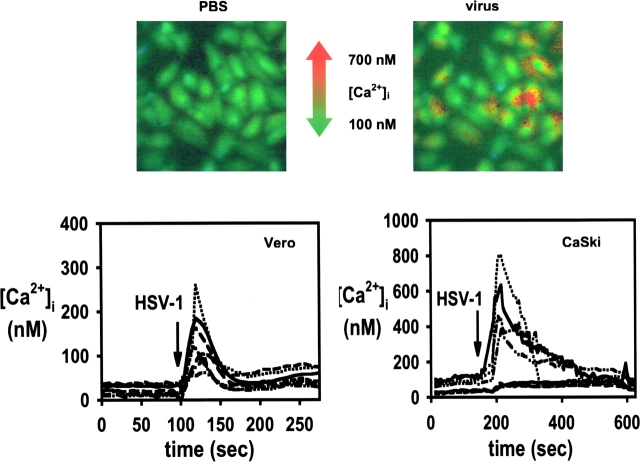
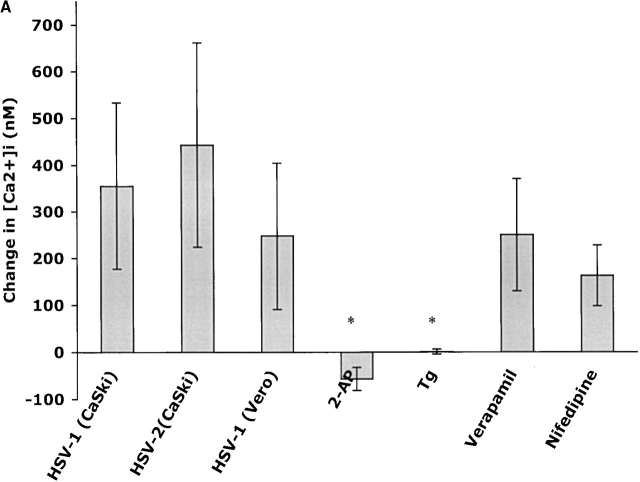
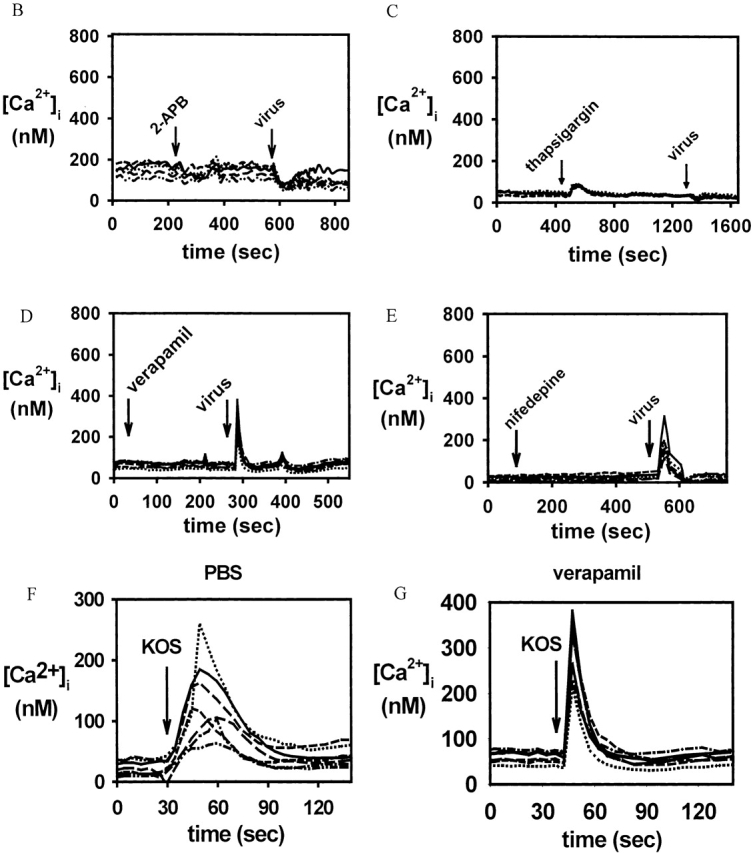
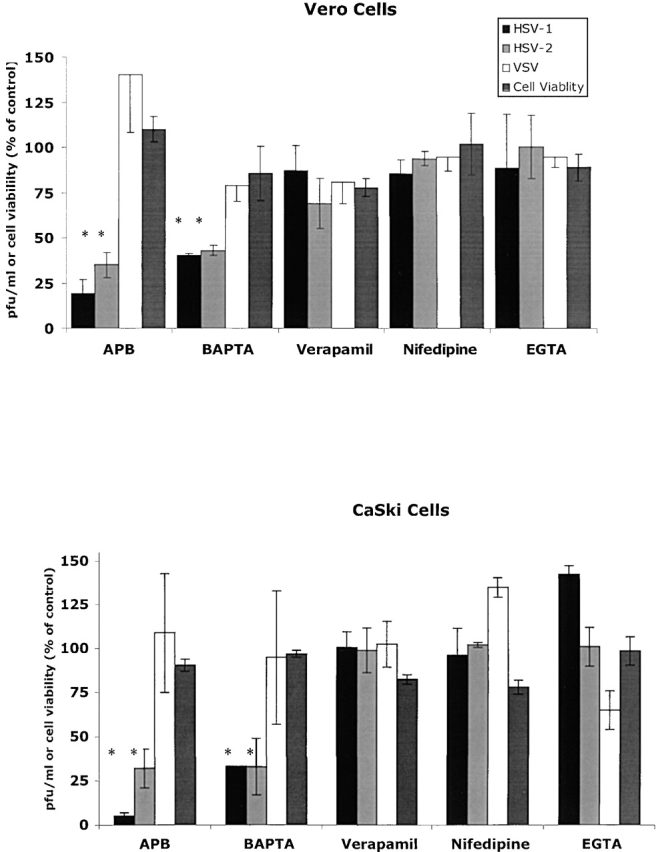
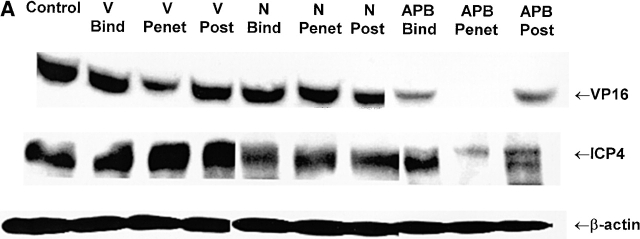
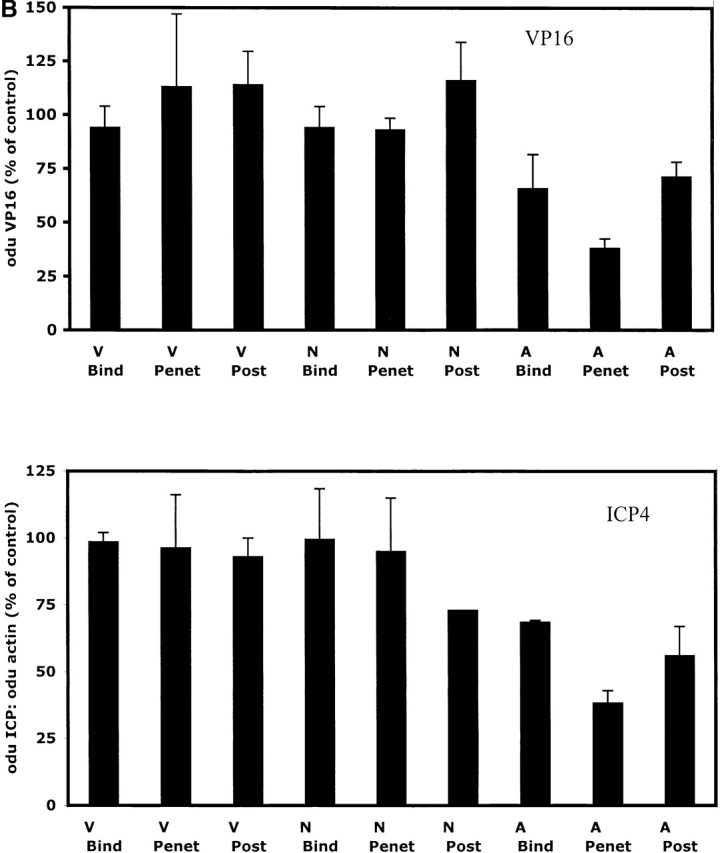
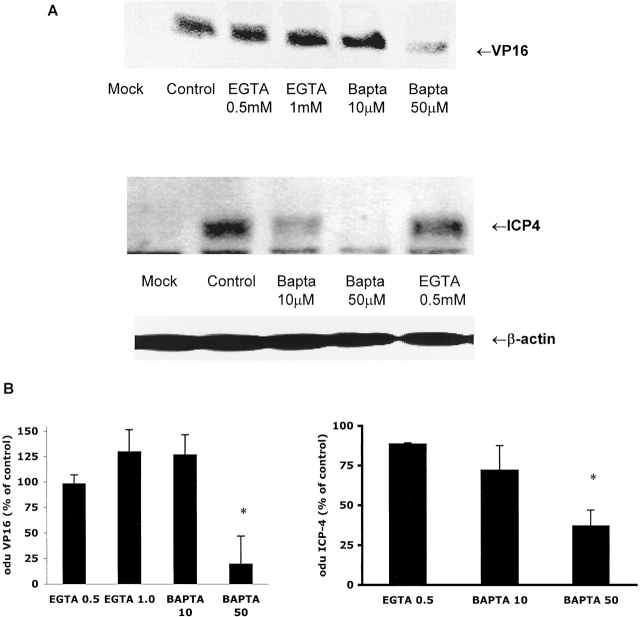
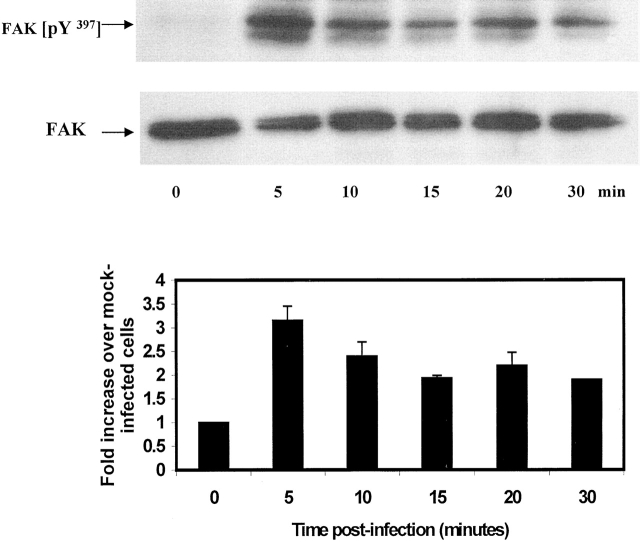
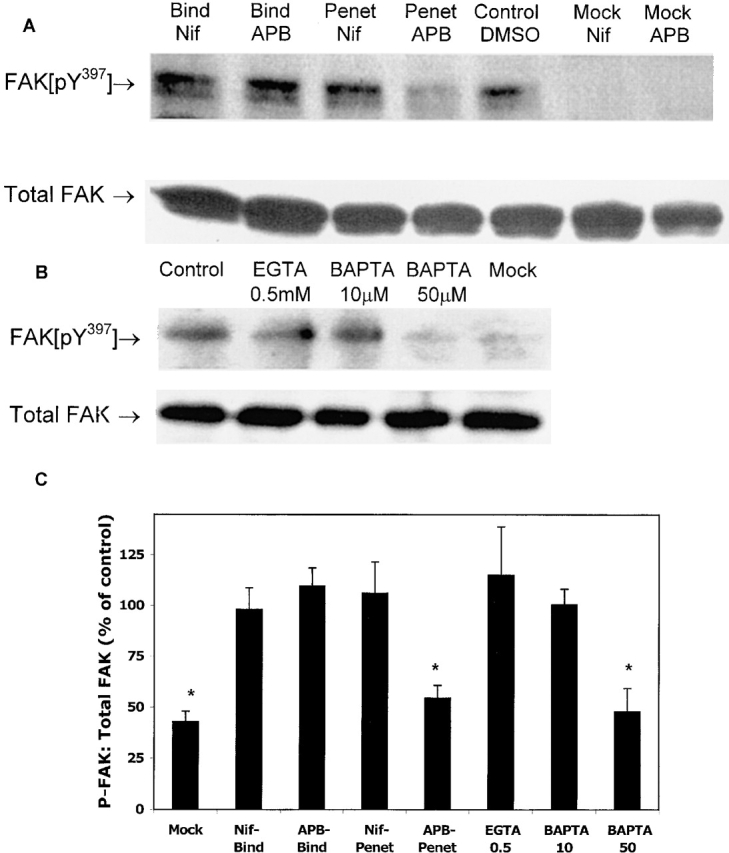
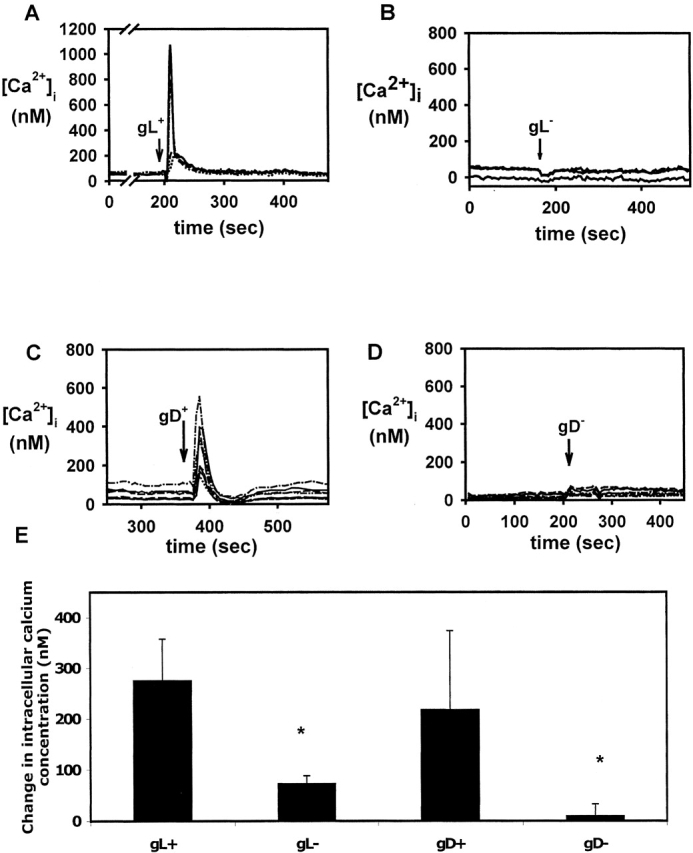
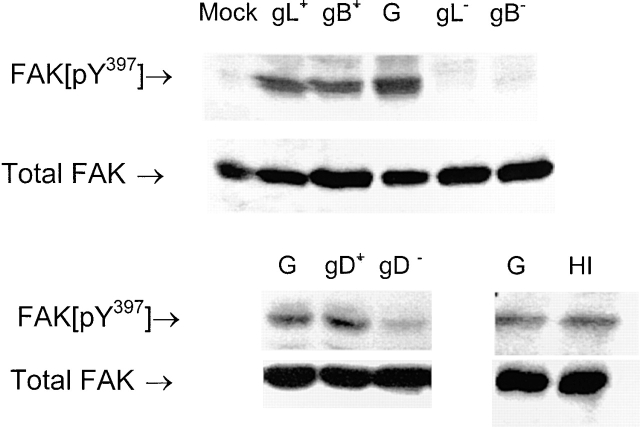
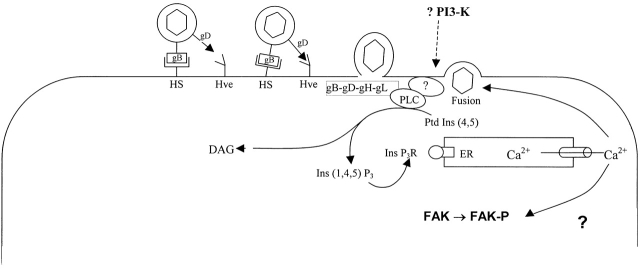
The cellular pathways required for herpes simplex virus (HSV) invasion have not been defined. To test the hypothesis that HSV entry triggers activation of Ca2+-signaling pathways, the effects on intracellular calcium concentration ([Ca2+]i) after exposure of cells to HSV were examined. Exposure to virus results in a rapid and transient increase in [Ca2+]i. Pretreatment of cells with pharmacological agents that block release of inositol 1,4,5-triphosphate (IP3)-sensitive endoplasmic reticulum stores abrogates the response. Moreover, treatment of cells with these pharmacological agents inhibits HSV infection and prevents focal adhesion kinase (FAK) phosphorylation, which occurs within 5 min after viral infection. Viruses deleted in glycoprotein L or glycoprotein D, which bind but do not penetrate, fail to induce a [Ca2+]i response or trigger FAK phosphorylation. Together, these results support a model for HSV infection that requires activation of IP3-responsive Ca2+-signaling pathways and that is associated with FAK phosphorylation. Defining the pathway of viral invasion may lead to new targets for anti-viral therapy.


Figures

Figure 1.
Figure 1.
The [Ca2 + ]i response to HSV. Vero or CaSki cells were loaded with the Ca2+ indicator dye Fura-2, exposed to HSV-1(KOS) (moi ∼1.0), and changes in [Ca2+]i were monitored. Representative fields from Vero cells as viewed under the microscope before (left) and ∼20 s after exposure to virus (right) are shown in the top panels, and the results from a single experiment for each cell type in which 5–7 individual cells were monitored are shown graphically below.
Figure 2.
Figure 2.
Changes in [Ca2 + ]i in response to HSV-1 or HSV-2 on CaSki cells and in response to HSV-1 in Vero cells pretreated with pharmacological inhibitors. Means of at least three independent experiments in the absence or presence of each drug are depicted in the bar graph (A); error bars indicate SD and the asterisks denote P < 0.001 by ANOVA (see text). Results are shown for individually monitored Vero cells after treatment with 100 μM 2-APB (B), 10 μM Tg (C), 10 μM verapamil (D), or 10 μM nifedipine (E), and subsequent challenge with HSV-1(KOS) (F and G). Time-expanded tracings of cells pretreated with PBS alone or with verapamil are shown in F and G, respectively.
Figure 2.
Figure 2.
Changes in [Ca2 + ]i in response to HSV-1 or HSV-2 on CaSki cells and in response to HSV-1 in Vero cells pretreated with pharmacological inhibitors. Means of at least three independent experiments in the absence or presence of each drug are depicted in the bar graph (A); error bars indicate SD and the asterisks denote P < 0.001 by ANOVA (see text). Results are shown for individually monitored Vero cells after treatment with 100 μM 2-APB (B), 10 μM Tg (C), 10 μM verapamil (D), or 10 μM nifedipine (E), and subsequent challenge with HSV-1(KOS) (F and G). Time-expanded tracings of cells pretreated with PBS alone or with verapamil are shown in F and G, respectively.
Figure 3.
Figure 3.
The ER Ca 2+ release is required for HSV infection. The effects of pretreating cells for 1 h with 50 μM BAPTA-AM, 0.5 mM EGTA, or adding 100 μM 2-APB, 10 μM nifedipine, or 10 μM verapamil during viral penetration on HSV-1(KOS), HSV-2(G), or VSV infection of Vero cells (top) or CaSki cells (bottom) were examined. Results are presented as pfu formed in the presence of the indicated concentration of drug as a percentage of pfu formed in cells treated with control buffer (5% DMSO for pharmacological inhibitors or 5% methanol for BAPTA), and are means of at least three independent experiments conducted in duplicate. Cytotoxicity of pharmacological agents was determined in parallel after a 2-h exposure to drug and quantifying viable, proliferating cells at 24 h by MTS assay. Cell viability results are expressed as odu reading in the presence of the drug as a percentage of odu reading in the presence of control buffer, and are means of two independent experiments conducted in triplicate. Asterisks denote P < 0.001, ANOVA compared with controls.
Figure 4.
Figure 4.
2-APB prevents VP16 nuclear transport and viral ICP4 expression. Time-course experiments were conducted to determine the effects of pharmacological inhibitors of Ca2+ signaling on VP16 transport to the nucleus and ICP4 expression after infection of CaSki cells with HSV-2(G). 10 μM verapamil (V), 10 μM nifedipine (N), or 100 μM 2-APB (A) were added during the 4°C binding period, at the time of temperature shift (penetration), or immediately after entry. Controls included cells treated with 5% DMSO. Nuclear extracts were prepared 4 h after infection for VP16 (top blot), and cell lysates were prepared 5 h after infection for ICP4 (middle blot). VP16 and ICP4 were detected by analyzing Western blots; lanes were loaded with extracts or lysates from equivalent cell numbers. The blots of cell lysates were also probed with mAb for β-actin to control for loading (bottom blot). The blots were scanned and the background from mock-infected cells was subtracted. (B) The odu for viral protein per odu for β-actin as a percentage of controls. Results are the mean ± SD obtained from three independent experiments.
Figure 4.
Figure 4.
2-APB prevents VP16 nuclear transport and viral ICP4 expression. Time-course experiments were conducted to determine the effects of pharmacological inhibitors of Ca2+ signaling on VP16 transport to the nucleus and ICP4 expression after infection of CaSki cells with HSV-2(G). 10 μM verapamil (V), 10 μM nifedipine (N), or 100 μM 2-APB (A) were added during the 4°C binding period, at the time of temperature shift (penetration), or immediately after entry. Controls included cells treated with 5% DMSO. Nuclear extracts were prepared 4 h after infection for VP16 (top blot), and cell lysates were prepared 5 h after infection for ICP4 (middle blot). VP16 and ICP4 were detected by analyzing Western blots; lanes were loaded with extracts or lysates from equivalent cell numbers. The blots of cell lysates were also probed with mAb for β-actin to control for loading (bottom blot). The blots were scanned and the background from mock-infected cells was subtracted. (B) The odu for viral protein per odu for β-actin as a percentage of controls. Results are the mean ± SD obtained from three independent experiments.
Figure 5.
Figure 5.
Effects of Ca2 + chelators on VP16 transport and ICP4 expression. CaSki cells were pretreated with BAPTA-AM, EGTA, or 5% methanol in PBS (control) for 2 h, washed three times, and then exposed to HSV-2(G) and nuclear extracts or cell lysates prepared as described in Materials and methods. (A) Representative blots probed for VP16 (top blot) or ICP4 (middle blot). Blots were also probed with mAb for β-actin to control for loading (bottom blot). The blots were scanned and the background from mock-infected cells was subtracted. (B) The odu for viral protein per odu for β-actin as a percentage of control (HSV-2 in the absence of pharmacological inhibitor). Results are the mean ± SD obtained from three independent experiments; asterisks indicate P < 0.001 by ANOVA.
Figure 6.
Figure 6.
HSV induces FAK phosphorylation within 5 min of exposure to virus. CaSki cells were serum starved overnight, exposed to HSV-2(G) or mock infected, and at the indicated times after infection, cell lysates were prepared and proteins were separated, transferred by Western blotting, and incubated with anti-FAK pY397 antibody. Blots were then stripped and reprobed with mAb to total FAK. Blots were scanned and the results are expressed as the increase in levels of phosphorylated FAK as a percentage of total FAK compared with mock-infected cells. Results are the mean ± SD obtained from three independent experiments.
Figure 7.
Figure 7.
2-APB and BAPTA-AM prevent viral-induced FAK phosphorylation. CaSki cells were serum starved overnight, and a synchronized infection with HSV-2(G) was conducted as described in Materials and methods. 100 μM 2-APB, 10 μM nifedipine, or control buffer (5% DMSO) was added to cells at the time of binding or penetration (temperature shift, 15 min, 37°C). Cells were treated with low pH citrate buffer, washed, and cell lysates were prepared 10 min after citrate treatment. Western blots were prepared, probed with anti-FAK pY397, and scanned by optical densitometry. Blots were then stripped and reprobed with mAb to total FAK. A representative blot is shown in A. Alternatively, cells were pretreated for 2 h with BAPTA-AM, EGTA, or 5% methanol in PBS (control), and then exposed to HSV-2(G). (B) Lysates were prepared 5 min after infection and analyzed by Western blotting for FAK phosphorylation. (C) Results obtained from three independent experiments are summarized graphically as odu of phosphorylated FAK:odu total FAK as a percentage of control (HSV-2(G) in the absence of any inhibitors). Results are the mean ± SD obtained from three independent experiments; asterisks indicate P < 0.001, ANOVA.
Figure 8.
Figure 8.
Viruses deleted in gL or gD fail to induce a Ca2 + response. Fura-loaded Vero cells were exposed to gL86 (A and B) or KOSgDβ (C and D) purified from complementing (left) or noncomplementing (right) Vero cells, and the [Ca2+]i (nM) response was monitored. (E) Results from a single experiment in which 3–7 cells were monitored are shown, and the mean Δ [Ca2+]i obtained from two independent experiments is depicted graphically. Results are the mean ± SD obtained from three independent experiments; asterisks indicate P < 0.001, ANOVA.
Figure 9.
Figure 9.
Viral penetration is required for FAK phosphorylation. Serum-starved CaSki cells were mock infected or exposed to HSV-1(KOS)gL86, HSV-1(KOS) gDβ, or HSV-2(g)gB-2 grown on complementing (+) or noncomplementing (−) cells as indicated or exposed to HSV-2 (G) or HI-HSV-2 (HI) virus and FAK phosphorylation monitored by preparing cell lysates 10 min after citrate treatment. Blots were probed with anti-FAK pY397 and then stripped and reprobed with mAb to total FAK. Gels are representative of at least two independent experiments.
Figure 10.
Figure 10.
Model of HSV entry. See Discussion for description.

References

    1. Alfano, M., H. Schmidtmayerova, C.A. Amella, T. Pushkarsky, and M. Bukrinsky. 1999. The B-oligomer of pertussis toxin deactivates CC chemokine receptor 5 and blocks entry of M-tropic HIV-1 strains. J. Exp. Med. 190:597–605. - PMC - PubMed
    1. Bakowski, D., M.D. Glitsch, and A.B. Parekh. 2001. An examination of the secretion-like coupling model for the activation of the Ca2+ release-activated Ca2+ current I(CRAC) in RBL-1 cells. J. Physiol. 532:55–71. - PMC - PubMed
    1. Baldwin, B.R., C.O. Zhang, and S. Keay. 2000. Cloning and epitope mapping of a functional partial fusion receptor for human cytomegalovirus gH. J. Gen. Virol. 81:27–35. - PubMed
    1. Berridge, M.J. 1995. Capacitative calcium entry. Biochem. J. 312:1–11. - PMC - PubMed
    1. Bierne, H., S. Dramsi, M.P. Gratacap, C. Randriamampita, G. Carpenter, B. Payrastre, and P. Cossart. 2000. The invasion protein InIB from Listeria monocytogenes activates PLC-gamma1 downstream from PI 3-kinase. Cell. Microbiol. 2:465–476. - PubMed

Publication types

MeSH terms