. 2003 Oct 28;100(22):13081-6.
doi: 10.1073/pnas.2133652100. Epub 2003 Oct 20.

Two-photon imaging of capillary blood flow in olfactory bulb glomeruli

Affiliations

Two-photon imaging of capillary blood flow in olfactory bulb glomeruli

Emmanuelle Chaigneau et al. Proc Natl Acad Sci U S A. .

Abstract

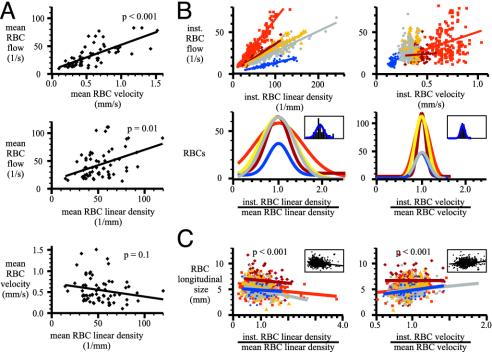
Analysis of the spatiotemporal coupling between neuronal activity and cerebral blood flow requires the precise measurement of the dynamics of RBC flow in individual capillaries that irrigate activated neurons. Here, we use two-photon microscopy in vivo to image individual RBCs in glomerular capillaries in the rat dorsal olfactory bulb. We find that odor stimulation evokes capillary vascular responses that are odorant- and glomerulus-specific. These responses consist of increases as well as decreases in RBC flow, both resulting from independent changes in RBC velocity or linear density. Finally, measuring RBC flow with micrometer spatial resolution and millisecond temporal resolution, we demonstrate that, in olfactory bulb superficial layers, capillary vascular responses precisely outline regions of synaptic activation.


Figures

Fig. 2.
Fig. 2.
Technical approaches to measure the parameters of RBC flow in single capillaries. (A) Transversal line scans (X direction) through capillaries were used to ensure the absence of lateral movements of capillaries as well as to observe RBC flow. Each RBC is seen as a shadow flowing through the fluorescent plasma. Longitudinal line scans (Y direction) were used to determine all RBC flow parameters. Note that the slope of oblique shadows and thus RBC velocity could vary (single and double arrowheads) and that occasionally two RBCs were stuck together (arrow). (B) Raw data were first binarized (see Methods), and values of instantaneous (inst.) flow (1/T), velocity (dy/dt), and longitudinal size (velocity.dτ) were determined for each RBC. Inst.RBC linear density was calculated as inst.RBC flow/inst.RBC velocity. Mean values of RBC flow, velocity, or linear density were determined as the time average of the instantaneous values calculated over 20- to 30-sec periods of acquisition. (C) Power spectrum analysis of inst.RBC flow reveals that heartbeat fluctuations were essentially observed in capillaries located near arterioles.
Fig. 1.
Fig. 1.
Vascular architecture of the superficial layers in the rat olfactory bulb. (A Left) Schematic representation of the olfactory bulb. Mc, mitral cell; Gc, granule cell; PGc, periglomerular cell. (A Right) Three glomeruli labeled with Oregon green dextran (see Methods) and imaged by using two-photon microscopy. The image is a two-dimensional projection of 50 images spaced by 2 μm in the Z direction (tissue thickness of 100 μm). Note that glomeruli are outlined by the juxtaglomerular zone. (Scale bar, 50 μm.) (B) Distribution of vessels in the ONL and GL. Intravenous injection of fluorescein dextran revealed that large vessels run through the ONL, whereas capillaries seem exclusively confined to the GL. The upper image corresponds to a 60-μm stack (30 images) and the lower image corresponds to a 100-μm stack (50 images). The location of the three glomeruli are outlined in white to illustrate that the periglomerular shadows correspond to the juxtaglomerular zone and not to possible light absorption by large superficial vessels. (C) Capillaries appear only in the GL, where they invade glomeruli. Four 20-μm stacks (10 images) made above (1) and through (24) the glomeruli, each one spaced 20 μm from the other. Note that capillaries are absent from the first stack (1). (D) Capillary count in two similar volumes located in and above the three glomeruli.
Fig. 3.
Fig. 3.
RBC flow, velocity, linear density, and longitudinal size at rest in glomerular capillaries. (A) Mean RBC flow was correlated to mean RBC velocity (Top) and to mean RBC linear density (Middle). Each dot corresponds to a capillary. Mean RBC velocity varied from 0.1 to 1.6 mm/sec, and mean RBC linear density varied from 14 to 120 RBCs per mm. (Bottom) Mean RBC velocity and linear density were independent. (B) Variations in inst.RBC flow were principally caused by fluctuations of inst.RBC linear density. Upper illustrates that for five capillaries and during a 20- to 30-sec acquisition, the number of RBCs per unit capillary length varied continuously and over a wide range, whereas inst.RBC velocity fluctuated much less. Bottom illustrates the extent of these fluctuations. For the five capillaries, the distribution of RBCs as a function of the ratio inst.RBC velocity/mean RBC velocity (Right) and the ratio of inst.RBC linear density/mean RBC linear density (Left) were plotted with a binning of 0.1 and fitted with a single Gaussian curve. Insets show for one capillary (in blue in Upper) the superposition of the histograms and the Gaussian curves. Note that velocity varies less than linear density. (C) Plots of RBC longitudinal size as a function of inst.RBC linear density/mean linear density (Left) and inst.RBC velocity/mean velocity (Right). At high linear density, RBCs assembled into piles of plates, whereas at high velocity, RBCs seemed to elongate. Insets show the regression lines corresponding to pooled data from the five capillaries. Note that inst.RBC velocity and linear density are independent (data not shown).
Fig. 4.
Fig. 4.
Isoamyl acetate stimulation evokes various types of RBC flow responses. (A) The odor evoked an increase in inst.RBC flow resulting from increases in both velocity and linear density (average of five odor stimulations). (B) The odor evoked an increase in inst.RBC flow resulting exclusively from an increase in inst.RBC velocity (average of seven odor stimulations). (C) The odor evoked an increase in the inst.RBC flow resulting from a large increase in inst.RBC velocity but accompanied by a decrease in inst.RBC linear density (average of six odor stimulations). Each graph was binned over 100 ms. The continuous line represents the sliding average over 10 bins (1 sec). (Upper) Raw data taken at the time indicated by the asterisks in the graphs.
Fig. 5.
Fig. 5.
Properties of odor-evoked vascular responses in a glomerulus. (A) Vascular responses in a given glomerulus are odor-specific. A glomerulus was labeled with Oregon green dextran (Upper Left), and capillaries were visualized after i.v. injection of fluorescein dextran (Lower Left). Isoamyl acetate (AA) induced similar increases in inst.RBC flow in two capillaries (arrows) from the same glomerulus (Top and Middle Right; average of six and five odor stimulations, respectively). Propionic acid (PA) induced a decrease in inst.RBC flow (Bottom Right; average of four odor stimulations). (B) Odor-evoked vascular responses are glomerulus-specific. Almond induced a large increase in inst.RBC flow in capillary 1 (arrow), located in an activated glomerulus, but not in capillary 2 (arrow), located in a neighboring glomerulus (average of four and three odor stimulations, respectively). Note that capillaries are interconnected and separated by ≈200 μm. (C) Vascular responses occur 1–2 sec after the neuronal response. The vascular response was considered to begin when two successive values exceeded twice the standard deviation of the noise. The field potential electrode and the capillary were located in the same glomerulus. A delay of 1.4 sec separated the electrical and the vascular responses (see the enlargement).

Comment in

  • The single capillary and the active brain.
    Shepherd GM. Shepherd GM. Proc Natl Acad Sci U S A. 2003 Oct 28;100(22):12535-6. doi: 10.1073/pnas.2336089100. Epub 2003 Oct 20. Proc Natl Acad Sci U S A. 2003. PMID: 14569016 Free PMC article. No abstract available.

References

    1. Villringer, A. & Dirnagl, U. (1995) Cerebrovasc. Brain Metab. Rev. 7 240-276. - PubMed
    1. Magistretti, P. J., Pellerin, L., Rothman, D. L. & Shulman, R. G. (1999) Science 283 496-497. - PubMed
    1. Attwell, D. & Iadecola, C. (2002) Trends Neurosci. 25 621-625. - PubMed
    1. Logothetis, N. K., Pauls, J., Augath, M., Trinath, T. & Oeltermann, A. (2001) Nature 412 150-157. - PubMed
    1. Smith, A. J., Blumenfeld, H., Behar, K. L., Rothman, D. L., Shulman, R. G. & Hyder, F. (2002) Proc. Natl. Acad. Sci. USA 99 10765-10770. - PMC - PubMed

Publication types

LinkOut - more resources