. 2003 Oct 22;23(29):9479-90.
doi: 10.1523/JNEUROSCI.23-29-09479.2003.

The role of microtubule-associated protein 2c in the reorganization of microtubules and lamellipodia during neurite initiation

Affiliations

The role of microtubule-associated protein 2c in the reorganization of microtubules and lamellipodia during neurite initiation

Leif Dehmelt et al. J Neurosci. .

Abstract

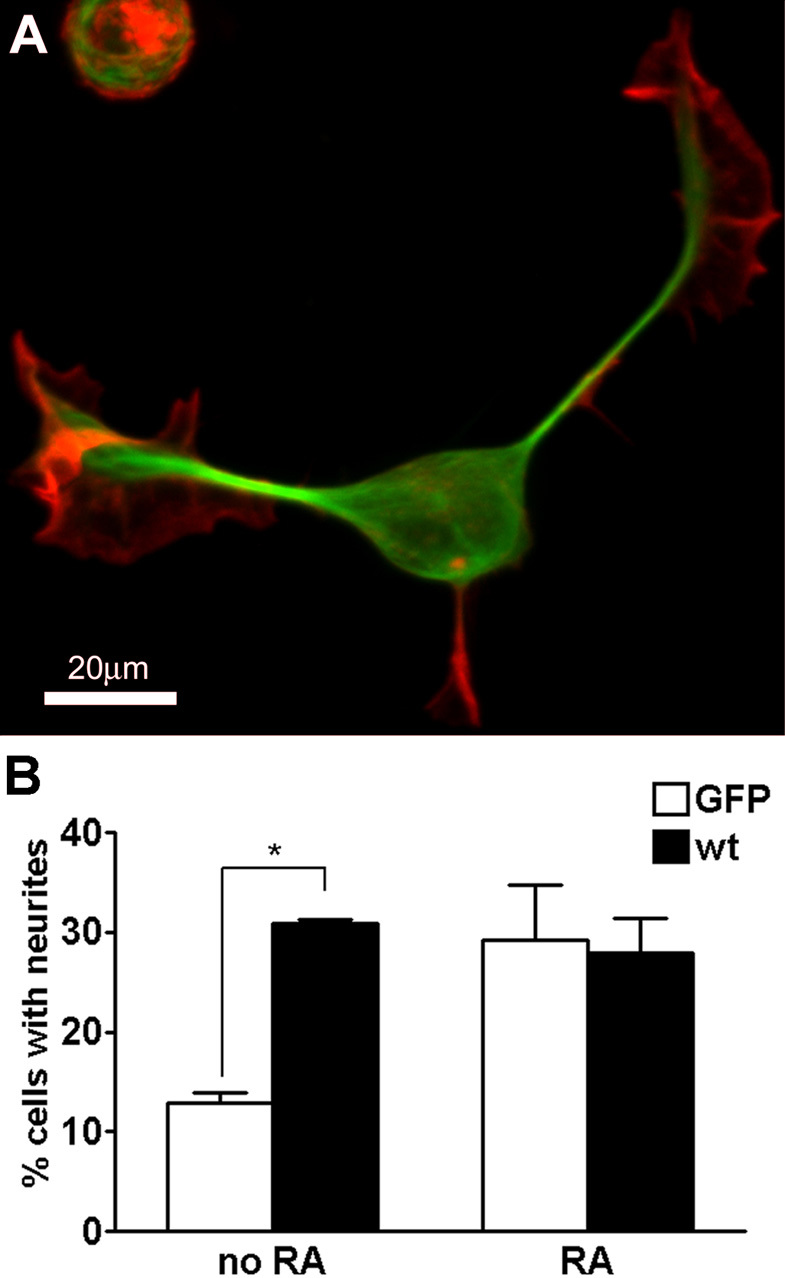
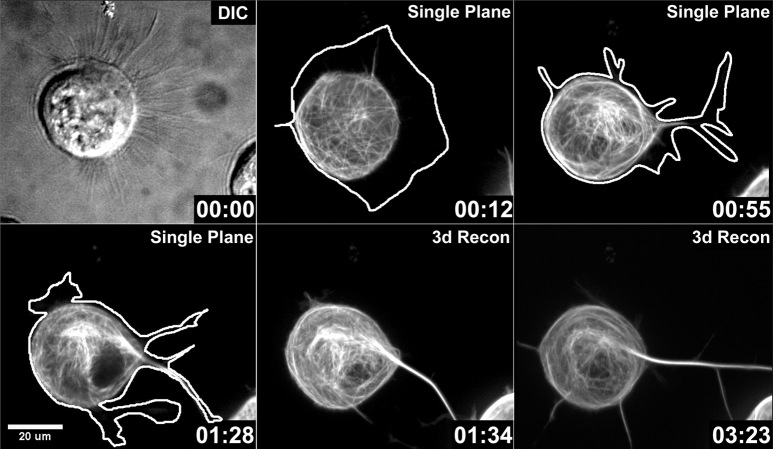
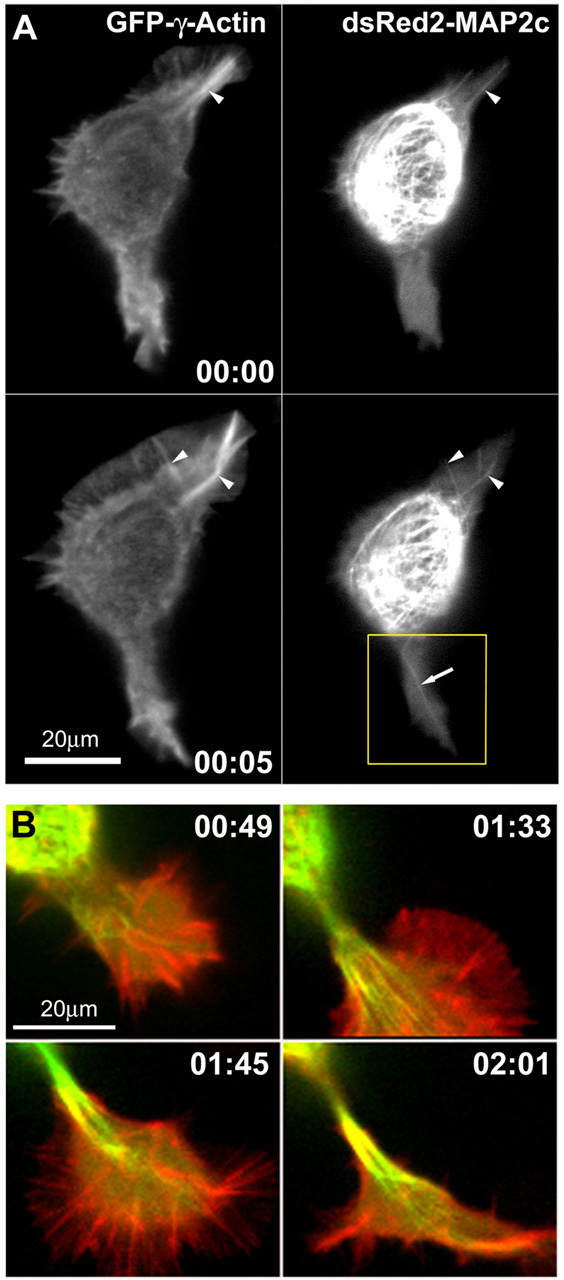
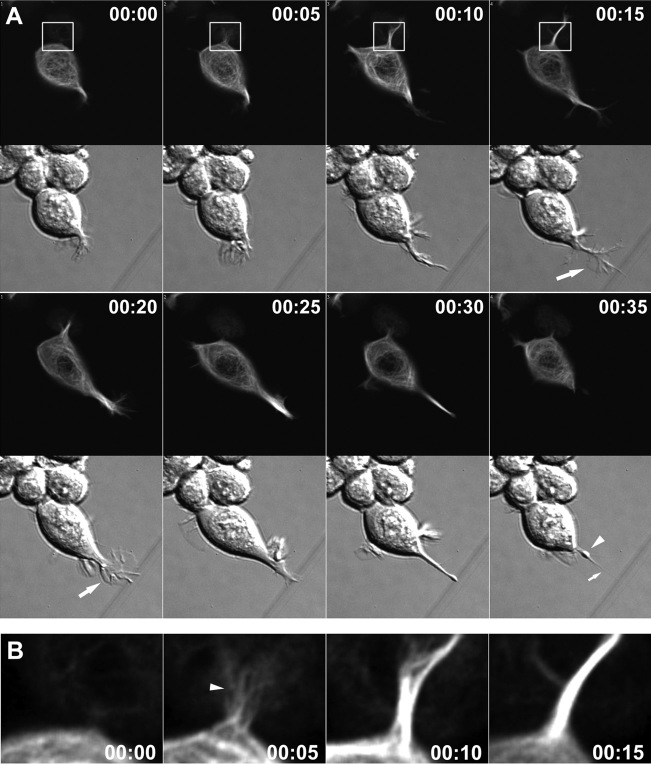
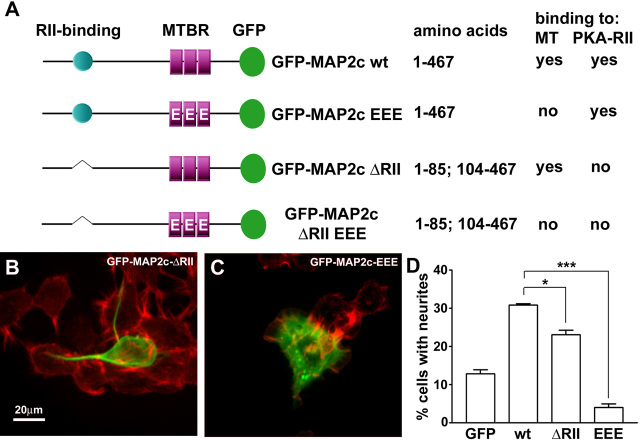
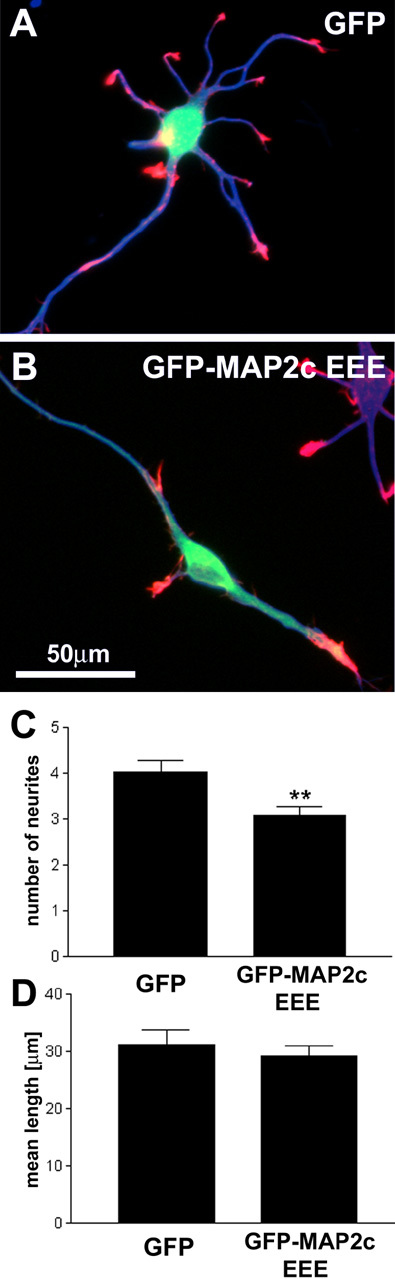
During neurite initiation, cells surrounded by a flattened, actin-rich lamellipodium transform to produce thin, microtubule-filled neurite shafts tipped by actin-rich growth cones, but little is known about this transformation. Our detailed time-lapse analyses of cultured hippocampal neurons, a widely used model system for neuronal development, revealed that neurites emerge from segmented lamellipodia, which then gradually extend from the cell body to become nascent growth cones. This suggests that actin- and microtubule-rich structures are reorganized in a coordinated manner. We hypothesized that proteins such as microtubule-associated protein 2 (MAP2), which can interact with both cytoskeletal components, might be critically involved in neurite initiation. Live-cell video and fluorescence microscopy in Neuro-2a cells showed that expression of MAP2c triggers neurite formation via rapid accumulation and bundling of stable, MAP2c-bound microtubules, concurrent with a gradual transformation of lamellipodia into nascent growth cones. The microtubule-stabilizing agent Taxol did not mimic this effect, suggesting that the ability of MAP2c to stabilize microtubules is not sufficient for neurite initiation. However, combination of Taxol treatment with actin disruption induced robust process formation, suggesting that inhibitory effects of F-actin need to be overcome as well. Neurite initiation by MAP2c required its microtubule-binding domain and was enhanced by its binding domain for cAMP-dependent protein kinase (PKA). MAP2c mutants defective in both PKA and microtubule binding acted as dominant negative inhibitors of neurite initiation in neuroblastoma cells and primary hippocampal neurons. Together, these data suggest that MAP2c bears functions that both stabilize microtubules and directly or indirectly alter actin organization during neurite initiation.


Figures

Figure 1.
Figure 1.
Hippocampal neurons initiate neurites by coordinated rearrangements of F-actin- and microtubule-rich structures. A, B, Cytoskeletal organization of cultured neurons before and after neurite initiation. Primary hippocampal neurons were prepared according to the method of Goslin et al. (1998), fixed 20 hr after plating, and stained for F-actin (red) and βIII-tubulin (green). Neurons that have not yet formed neurites are characterized by fairly uniform actin-rich lamellipodia (A). After neurite formation (B), microtubules become bundled inside elongated, thin neurite shafts. The original actin-rich lamellipodia transform into smaller structures, called growth cones, on the tips of these neurites. At both stages, microtubules are concentrated in the cell body and neurites. However, note that single microtubules invade the actin-rich structures and are frequently seen to align with F-actin cables in filopodia (insets). C, Morphological changes in actin-rich lamellipodia are coordinated with the growth of microtubule-rich neurites. DIC images were acquired beginning 1 hr after plating. Time points (hours:minutes) were selected to illustrate the appearance of representative intermediates of neurite initiation (also see Fig 1.mov). Initially, most neurons display one or few fairly uniform lamellas (00:00, arrowhead). Then these veil-like structures segregate (04:10, small arrows) to form multiple individual lamellipodia, which begin to resemble growth cones. After a delay, neurite elongation proceeds, and a thin shaft condenses between cell body and nascent growth cone (04:44, 06:23, large arrows). During this time, some lamellipodia continue to segment still further (06:23, small arrows). The delay is highly variable, ranging from minutes to hours. In the example shown, after a second delay, one minor process elongated rapidly and eventually became the axon (19:59, asterisk), as is typical of hippocampal neurons.
Figure 2.
Figure 2.
MAP2c is sufficient to induce neurite formation. A, Neuro-2a cell transfected with GFP-MAP2c (green), fixed with glutaraldehyde after 24 hr, and stained for F-actin (red). B, Quantification of neurite initiation by MAP2c. Neuro-2a cells were transfected with GFP-MAP2c or control plasmids in the absence or presence of 40 μm retinoic acid (RA) and evaluated for neurite formation as described in Materials and Methods. MAP2c induced neurites to a similar extent as retinoic acid treatment. Overexpression of MAP2c had no additional effect on retinoic acid-induced neurite induction. Data represent three independent experiments each with >100 cells evaluated per treatment condition (*p < 0.05, one-way ANOVA). wt, Wild type.
Figure 6.
Figure 6.
Neuro-2a cells form neurite-like processes in response to the combined action of Taxol and inhibitors of actin dynamics. A, Four hours after application of 1 μm Taxol alone or combined with 4 μm cytoD, 1 μm latA, or 40 nm jasp, cells were fixed and stained for α-tubulin (green) and F-actin (red) and imaged using confocal microscopy. B, Concentration dependence of process induction in Neuro-2a cells after 4 hr of incubation with the indicated actin-disrupting drug in the presence of 1 μm Taxol. Processes were identified as described in Materials and Methods, and >100 cells were evaluated per data point. C, Representative kymograph obtained for measurement of retrograde flow (rf) before and after application of 1 μm Taxol and 40 nm jasp (for the DIC time-lapse recording used to produce this kymograph, see Fig 6.mov). The image represents a depiction of pixel intensity values measured along the yellow line indicated in the inset at the right, plotted as distal to proximal in the horizontal dimension and elapsed time in the vertical dimension. Diagonal lines represent the retrograde movement of particles within the lamellipodium. These were used to measure the velocity of retrograde flow. The two panels depict the first and second 30 min of the time-lapse sequence, respectively. D, Comparison of MAP2c-induced neurites (green, EGFP-MAP2c) with drug-induced processes (enlargements from A; green, α-tubulin) and minor processes of primary hippocampal neurons (HN; green, endogenous MAP2). F-actin is stained using phalloidin (red). All processes contained a microtubule array in the shaft. MAP2c-induced neurites usually terminated in growth cones, whereas neurites induced by Taxol plus jasp were devoid of detectable growth cones, and neurites induced by Taxol plus cytoD terminated in small F-actin-containing structures. Note that jasp competes with phalloidin binding, leading to underestimation of F-actin content in the image. However, DIC images confirm the lack of normal growth cones (see Fig 6.mov).
Figure 3.
Figure 3.
Lamellipodia segregate and condense during MAP2c-induced neurite initiation. Neuro-2a cells were transfected with GFP-MAP2c and imaged using confocal microscopy as described in Materials and Methods. The extent of the plasma membrane of the cell (white line) was manually traced from images in which low-level signals were maximized. At the beginning of the time sequence, the cell exhibited a broad lamellipodium (00:00, 00:12) surrounding a large portion of the cell body. MAP2c-decorated microtubules were readily visualized during the time course. During the first minutes, single microtubules or small microtubule bundles emerged from the soma and penetrated into the lamellipodium without inducing neurites (00:12). At a later stage (00:55), the lamellipodium became segmented, and shortly thereafter, a thick microtubule bundle rapidly formed (00:55, 01:28, 01:34). This neurite remained stable for at least 2 hr (also see Fig 3.mov; time points represent hours:minutes). Fluorescent images represent either confocal planes or three-dimensional reconstructions (3d Recon).
Figure 4.
Figure 4.
Changes in microtubules and F-actin during neurite initiation. A, MAP2c-decorated microtubules frequently align with actin cables in lamellipodia of Neuro-2a cells (also see Fig 4.mov; time points represent hours:minutes). Neuro-2a cells were cotransfected with plasmids encoding GFP-γ-actin and dsRED2-MAP2c and imaged using a spinning disk confocal microscope. Red and green fluorescence signals were acquired at intervals of 10 sec, with a time delay of 3.5 sec between the two channels. Single MAP2c-decorated microtubules (arrow) frequently invade deeply into the lamellipodia and align with actin cables (arrowheads). At time 0:05, a large actin bundle in the lamellipodium at the top right breaks, and an associated microtubule bundle appears to break in concert. The boxed region is shown in B at later time points, as this protrusion goes on to produce a neurite. B, Disordered microtubule arrays become ordered and aligned into bundles to form a neurite shaft. These panels depict four later time points in observations of the lower lamellipodium shown in A. Images are digital overlays of the GFP-actin fluorescence shown here in red and the dsRed2-MAP2c fluorescence shown here in green. Initially, the process is invaded by multiple microtubules, which are disorganized (0:44) but eventually become aligned into quasiparallel arrays (1:33). Thereafter, the microtubule array becomes quickly condensed into a compact bundle (1:45). The process elongates as microtubules continue to advance distally into the growth cone, and they become tightly packed into bundles behind the growth cone core (02:01).
Figure 5.
Figure 5.
Neurites in Neuro-2a cells exhibit dynamic behaviors. A, Growth cone dynamics in MAP2c-transfected Neuro-2a cells. Simultaneous DIC and fluorescence imaging of a GFP-MAP2c-transfected cell revealed the rapid formation of a growth cone-like structure (large arrows) at the tip of a newly formed neurite (also see Fig 5.mov; time points represent hours:minutes). On encountering a nonpermissive substrate (a scratch in the surface of the coverslip), the growth cone structure collapsed, and the neurite retracted rapidly, showing morphological characteristics of those in primary neurons, including a retraction bulb (arrowhead) and trailing membrane remnants (small arrow). B, Rapid bundling of MAP2c-decorated microtubules during process formation. Shown is a magnified view of the boxed portion of A. During the first 5 min, a short protrusion containing a few unbundled MAP2c-decorated microtubules was formed (arrowhead). During the next 10 min, the microtubules quickly formed a packed array to produce a transient, neurite-like structure.
Figure 7.
Figure 7.
Functional significance of MAP2c-interacting proteins during neurite initiation. Neuro-2a cells were transfected to express variants of GFP-MAP2c (green), fixed, and stained for F-actin (red). A, Domain diagram depicting MAP2c mutants used in this study. B, Cells transfected with GFP-MAP2c-ΔRII were able to induce neurites; however, the efficiency was significantly reduced. C, Pseudophosphorylated MAP2c (GFP-MAP2c-EEE), which is strongly impaired in microtubule binding, failed to induce neurites. D, Quantification of neurite formation. Data represent three independent experiments, each with >100 cells evaluated per treatment condition (*p < 0.05; ***p < 0.001, one-way ANOVA). MT, Microtubules; MTBR, microtubule binding repeats; wt, wild type.
Figure 8.
Figure 8.
Expression of MAP2c pseudophosphorylated at KXGS sites blocks retinoic acid-induced neurite formation. Neuro-2a cells were treated with retinoic acid 4 hr after transfection for a total time of 24 or 72 hr. Cells were fixed and analyzed for the presence of neurites using combined phase contrast and fluorescence microscopy (transfected cells are marked by asterisks). A, The expression of GFP alone did not inhibit retinoic acid-induced neurite formation. B, C, Expression of the mutants GFP-MAP2c-EEE (B) and GFP-MAP2c-EEEΔRII (C) significantly reduced neurite initiation. D, Quantification of neurite formation. Retinoic acid (RA) induced a significant increase in neurite number, which was inhibited by the EEE mutants of GFP-MAP2c to control levels. Data represent three independent experiments, each with >100 cells evaluated per treatment condition (**p < 0.01 for 24 hr RA; p < 0.001 for 72 hr RA, one-way ANOVA).
Figure 9.
Figure 9.
MAP2c EEE inhibits neurite initiation in primary hippocampal neurons. Primary hippocampal neurons were transfected with GFP or GFP-MAP2c EEE (green) 1 d after plating. Neurons were fixed 24 hr after transfection and stained for the neuron-specific marker βIII-tubulin TUJ1 (blue) and F-actin (red). A, Transfection of GFP alone does not induce significant alterations in the development of hippocampal neurons. B, Transfection of GFP-MAP2c-EEE induces a significant reduction of neurite number. Other aspects of neuromorphogenesis, such as polarization and axon elongation and branching, appear normal during this time frame. C, Quantification of neurite number per cell (defined as protrusions of length >10 μm). Data represent three independent experiments with a total of 40 neurons evaluated per treatment condition (**p < 0.01, Student's t test). Axons were excluded from the analysis. D, Quantification of mean neurite length per cell (total neurite arbor/number of neurites). Data represent three independent experiments with a total of 40 neurons evaluated per treatment condition (p > 0.05, Student's t test). Axons were excluded from the analysis.

References

    1. Bernhardt R, Matus A ( 1984) Light and electron microscopic studies of the distribution of microtubule-associated protein 2 in rat brain: a difference between dendritic and axonal cytoskeleton. J Comp Neurol 226: 203-221. - PubMed
    1. Bubb MR, Spector I, Beyer BB, Fosen KM ( 2000) Effects of jasplakinolide on the kinetics of actin polymerization: an explanation for certain in vivo observations. J Biol Chem 275: 5163-5170. - PubMed
    1. Burgin KE, Ludin B, Ferralli J, Matus A ( 1994) Bundling of microtubules in transfected cells does not involve an autonomous dimerization site on the MAP2 molecule. Mol Biol Cell 5: 511-517. - PMC - PubMed
    1. Caceres A, Banker GA, Binder L ( 1986) Immunocytochemical localization of tubulin and microtubule-associated protein 2 during the development of hippocampal neurons in culture. J Neurosci 6: 714-722. - PMC - PubMed
    1. Caceres A, Mautino J, Kosik KS ( 1992) Suppression of MAP2 in cultured cerebellar macroneurons inhibits minor neurite formation. Neuron 9: 607-618. - PubMed

Publication types

MeSH terms

LinkOut - more resources