. 2003 Oct 22;23(29):9600-10.
doi: 10.1523/JNEUROSCI.23-29-09600.2003.

Firing properties of spinal interneurons during voluntary movement. I. State-dependent regularity of firing

Affiliations

Firing properties of spinal interneurons during voluntary movement. I. State-dependent regularity of firing

Yifat Prut et al. J Neurosci. .

Abstract

The firing properties of single spinal interneurons (INs) were studied in five awake, behaving monkeys performing isometric or auxotonic flexion-extension torques at the wrist. INs tended to fire tonically at rest (mean rate, 14 spikes (sp)/sec) and during generation of static torque (mean rate, 19 sp/sec in flexion, 24 sp/sec in extension). INs exhibited regular firing, with autocorrelation functions showing clear periodic features and a mean coefficient of variation of interspike intervals (CV) of 0.55 during production of static torque. For the population, there was an inverse correlation between CV and mean rate. However, 46% of the INs had task-dependent changes in regularity that were not predicted by changes in firing rate, suggesting that their firing pattern is determined not only by the intrinsic properties of the neurons but also by the properties of its synaptic inputs. INs showed two main response types to passive wrist displacement: biphasic and coactivation. Cells with these sensory responses had different, stereotypical temporal activity profiles and firing regularity during active movement. However, INs having correlational linkages with forearm muscles, identified as features in spike-triggered averages of electromyographic activity, did not exhibit unique responses or firing properties, although they tended to fire more regularly than other INs. This suggests the lack of a precise mapping of inputs to outputs for the spinal premotor network.


Figures
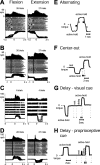
Figure 1.
Figure 1.
Behavioral tasks and unit responses for four spinal INs recorded during an alternating task (A, E), a center-out task (B, F), or a delayed response task with visual (C, G) or proprioceptive (D, H) cues. A-D, Histograms of unit firing are shown for flexion (left) and extension (right) trials, above raster plots and torque traces for individual trials. Histograms were computed using a 50 msec bin size without smoothing. E-H, Torque traces from two to four individual trials are shown for each task. The beginning and end of the dynamic torque, or active-ramp, period are shown by the black and gray symbols, respectively, on raster plots in A-D and the torque traces in E-H. G, H, Small squares indicate, in order, the appearance of the center box, cue onset, and the disappearance of the center box (end of trial). Raster plots and torque traces are aligned on zero-crossing times of the torque trace in A and on torque onset in B-D. Upward deflection of torque traces is flexion; downward deflection is extension (for all figures).
Figure 2.
Figure 2.
Distributions of average firing rates for single INs for the rest (A), flexion active-ramp (B), and active-hold (C) and extension active-ramp (D) and active-hold (E) periods. The number of units and the mean rate are given for each distribution.
Figure 3.
Figure 3.
Autocorrelation functions (top) and ISI distributions (bottom) of four well isolated INs having clear refractory periods. Insets expand the near-zero segment of the ISI distribution. A, IN exhibiting regular firing, seen as periodicity in the autocorrelation function; the narrow ISI distribution shows regular firing at the single-spike level. B, IN exhibiting regular firing. C, IN exhibiting irregular firing, similar to a Poisson process. D, IN that fired in short, high-frequency bursts. Flx, Flexion; Ext, extension; trigs, trigger spikes.
Figure 4.
Figure 4.
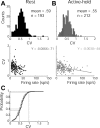
Distribution of average CVs (top) during rest period (A) and the last 1 sec of the active-hold periods (flexion and extension combined) for cells exhibiting a tonic response (B). Bottom graphs plot the relationship between average CV and average firing rate. Regression lines for the rest (A) and active-hold (B) periods have significant negative slopes (p < 0.01), indicating a tendency for increased regularity with increased rate, but were not significantly different from each other. The cumulative distributions of the average CVs (C) for the rest (black line) and active-hold (gray line) periods show a tendency for average CVs to be lower during the active-hold period, which may be accounted for by the average increase in rate during this period.
Figure 5.
Figure 5.
Relationships between CVi and firing rate for six well isolated INs (A-F) during the rest period (green) and active-hold periods in flexion (red) and extension (blue). CVi and rate were computed from a fixed number of intervals (10 in B-D, F, 20 in A, E). ISI distributions for each epoch are shown above the plots; insets expand the near-zero segment of the distribution. The unit in A showed a monotonic decrease in CVi with increasing rate. Units in B, C, F exhibited an increase in CVi with increasing rate. For units in D, E, CVi-rate plots for different task epochs had similar slopes but different y-intercepts.
Figure 6.
Figure 6.
Distribution of average CVs during the rest period (A) and the active-hold periods (B; flexion and extension combined) for U-INs (white bars) and INs with correlational linkages with muscles (gray bars). The mean average CV of U-INs during the rest period (0.58; n = 86) was not significantly different from the mean (0.56; n = 73) for INs with correlational linkages with muscles (Kruskal-Wallis, p > 0.14). In contrast, the mean average CVs during the active-hold periods of U-INs (0.58; n = 95) and INs with correlational linkages with muscles (0.48; n = 79) were significantly different (Kruskal-Wallis, p < 0.0002). The arrow in B shows the mean average CV of 13 MNs during the active-hold period in their preferred direction.
Figure 7.
Figure 7.
Activity of three INs (A-C) during active generation of torque (top) and responses to passive wrist displacement (bottom). Histograms of unit firing are shown for flexion (left) and extension (right) above raster plots and torque traces for individual trials. Active responses are aligned on torque onset, and passive responses are aligned on perturbation onset. B, IN with a coactivation (C-type) response. B, IN with a biphasic (B-type) response. C, IN with a monophasic (M-type) response. M-type responses were not as stereotypical in appearance as B- and C-type responses.
Figure 8.
Figure 8.
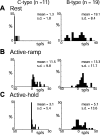
Rate distributions of C-type (left) and B-type (right) INs during rest (A), active-ramp (B), and active-hold (C) periods (flexion and extension combined). A, Absolute firing rate. B, C, Rate modulation relative to rest. Mean and SD are given for each plot.
Figure 9.
Figure 9.
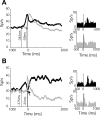
Histograms of firing during active generation of torque (left) and passive wrist displacement (right) for two INs (A, B) with B-type responses to wrist perturbations. Black histograms show activity for the direction of movement that produced the largest response during the active-hold period (i.e., preferred direction for active movements). Gray histograms show activity for the opposite direction. Histograms are aligned on movement onset (left) or stimulus onset (right). Both INs have opposite preferred directions for active and passive movements. Small arrowheads indicate onset times for active movement. Both neurons had earlier onset times for active movements in the preferred than the nonpreferred direction. In B, phasic increase (large gray arrow) and decrease (large black arrow) in firing near movement onset probably reflect the sensory response of the neuron to wrist displacement (note directional and temporal similarity with passive responses shown to the right).
Figure 10.
Figure 10.
Distributions of average CVs for C-type (gray) and B-type (black) INs (left) and the relationship between average CV and firing rate during rest (small circles), active-ramp (large circles), and active hold (triangles) periods.
Figure 11.
Figure 11.
Relationship between CVi and firing rate for a B-type cell with a significant behavioral effect on the residuals. Data are plotted for rest period (green) and active-hold periods in flexion (red) and extension (blue).

References

    1. Abeles M, Lass Y ( 1975) Transmission of information by the axon. II. The channel capacity. Biol Cybern 19: 121-125. - PubMed
    1. Baker SN, Spinks R, Jackson A, Lemon RN ( 2001) Synchronization in monkey motor cortex during a precision grip task. I. Task-dependent modulation in single-unit synchrony. J Neurophysiol 85: 869-885. - PubMed
    1. Beierholm U, Nielsen CD, Ryge J, Alstrom P, Kiehn O ( 2001) Characterization of reliability of spike timing in spinal interneurons during oscillating inputs. J Neurophysiol 86: 1858-1868. - PubMed
    1. Bennett BD, Wilson CJ ( 1999) Spontaneous activity of neostriatal cholinergic interneurons in vitro. J Neurosci 19: 5586-5596. - PMC - PubMed
    1. Butt SJ, Harris-Warrick RM, Kiehn O ( 2002) Firing properties of identified interneuron populations in the mammalian hindlimb central pattern generator. J Neurosci 22: 9961-9971. - PMC - PubMed

Publication types

LinkOut - more resources