. 2003 Oct 22;23(29):9664-74.
doi: 10.1523/JNEUROSCI.23-29-09664.2003.

Major differences in inhibitory synaptic transmission onto two neocortical interneuron subclasses

Affiliations

Major differences in inhibitory synaptic transmission onto two neocortical interneuron subclasses

Alberto Bacci et al. J Neurosci. .

Abstract

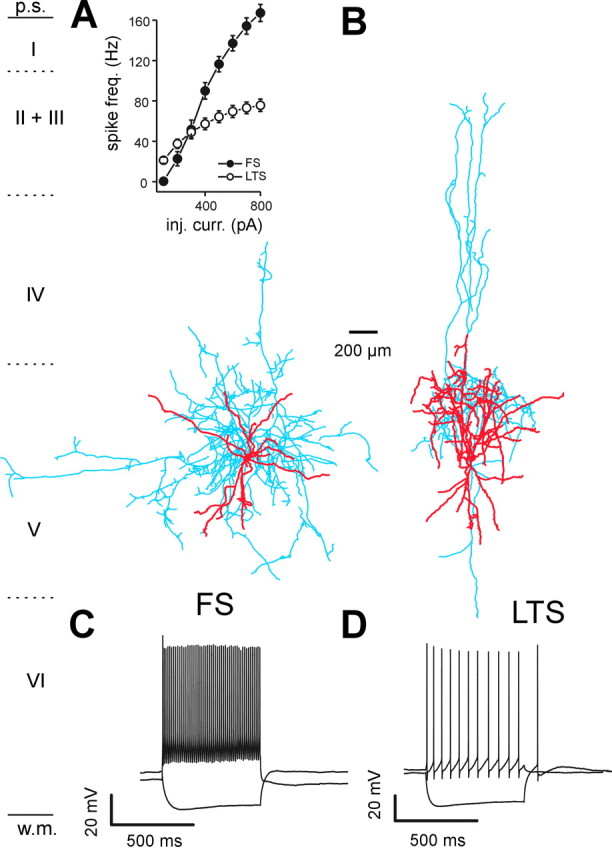
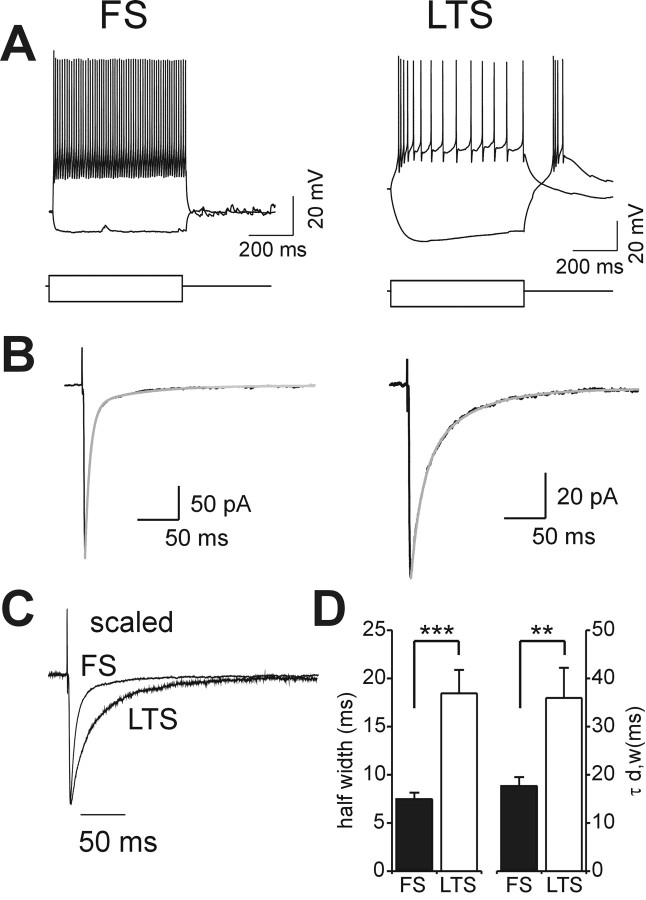
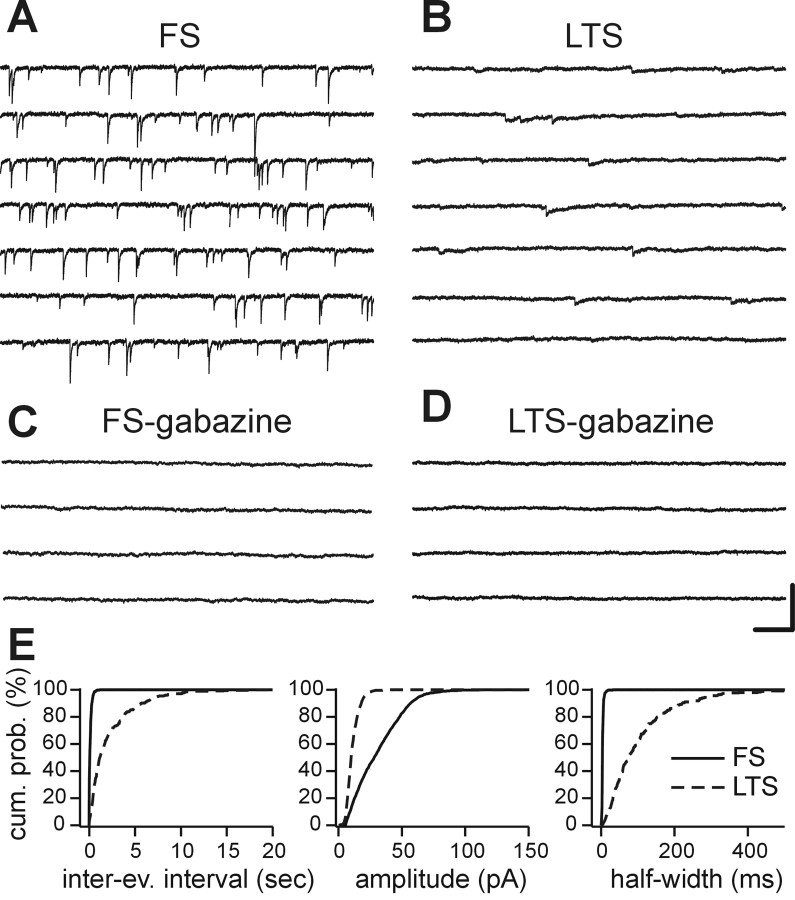
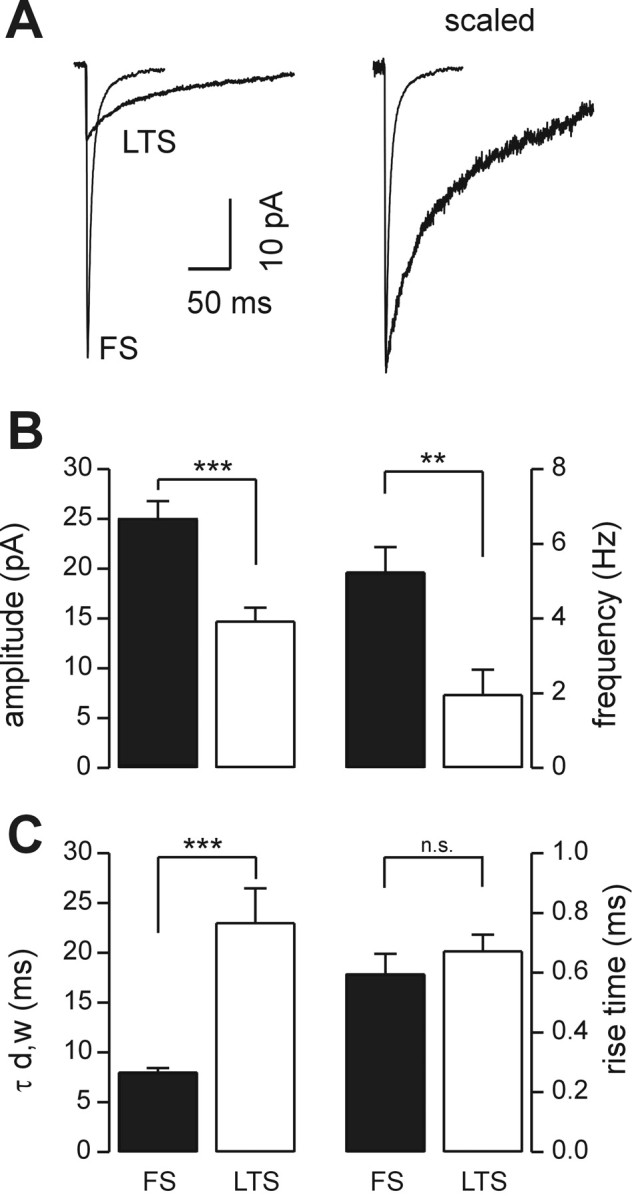
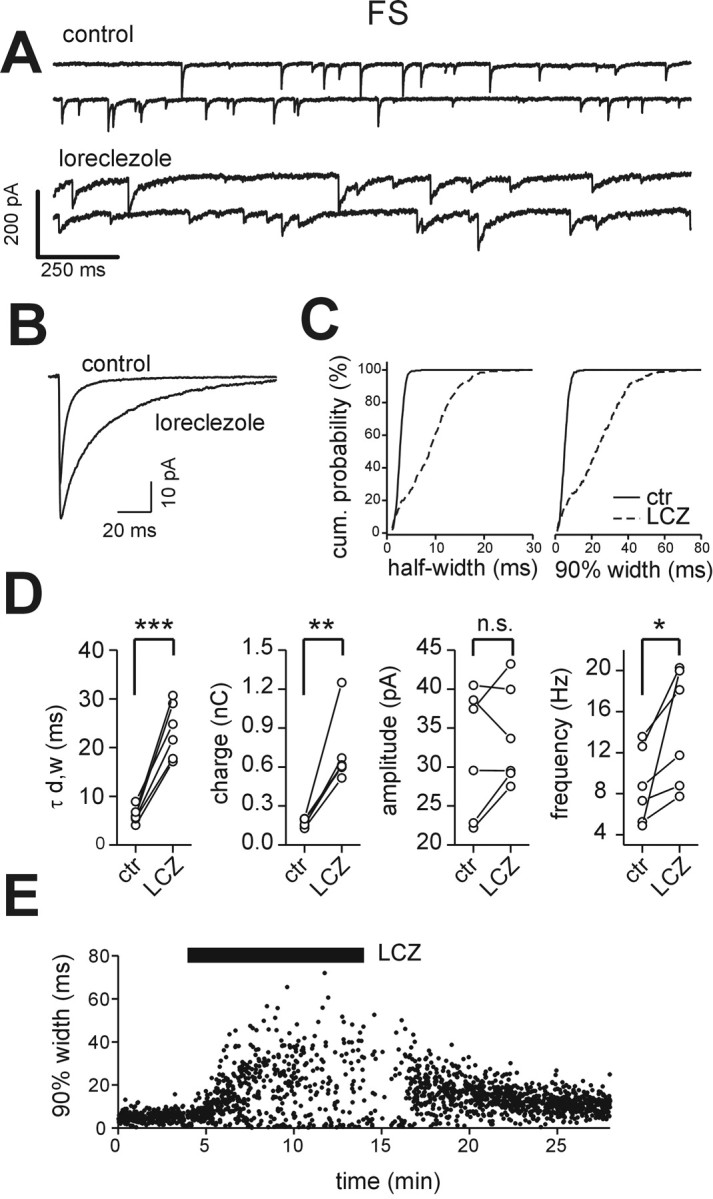
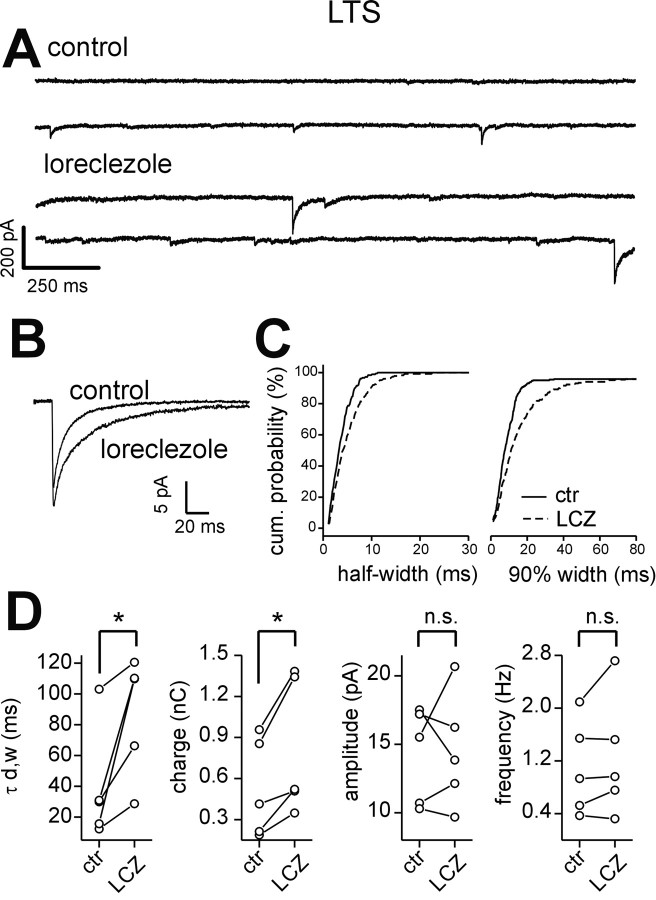
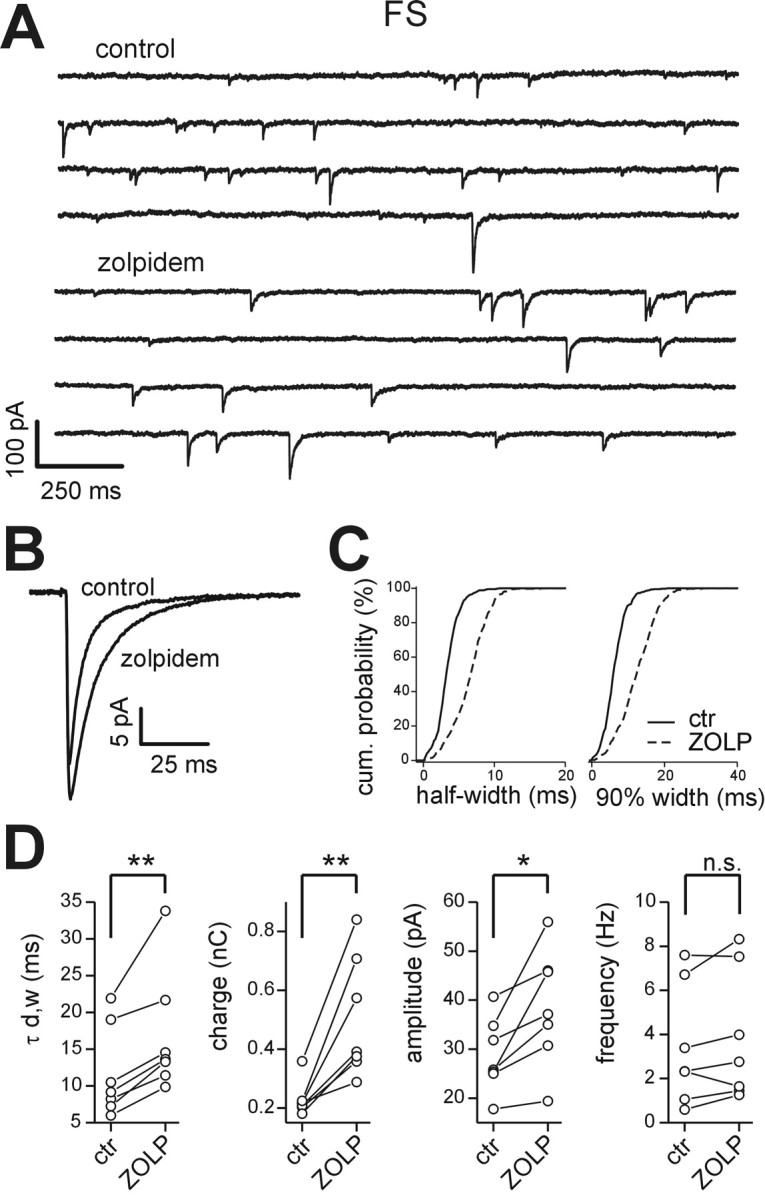
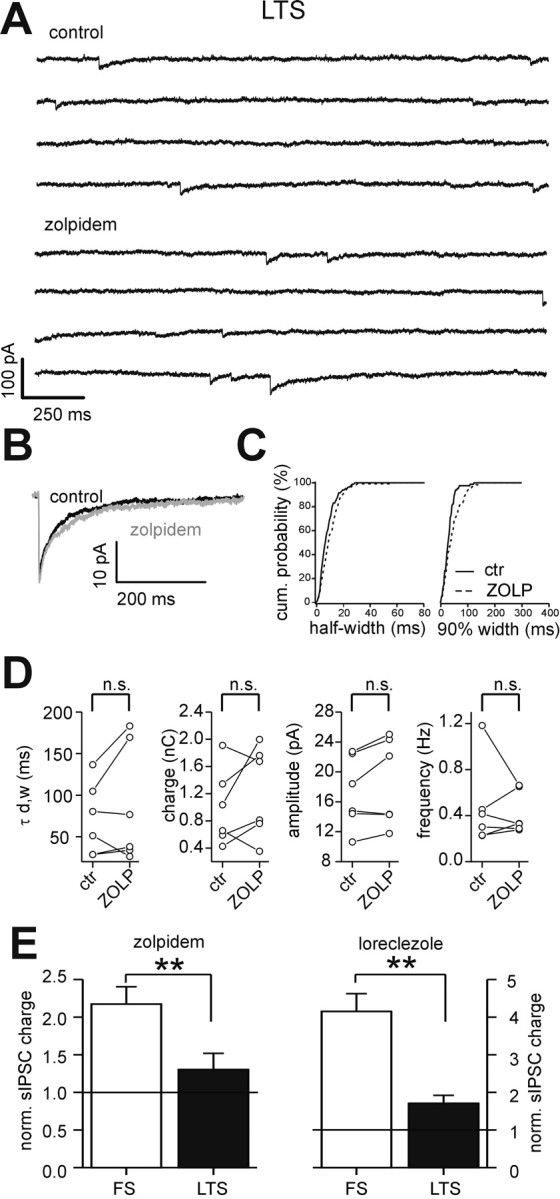
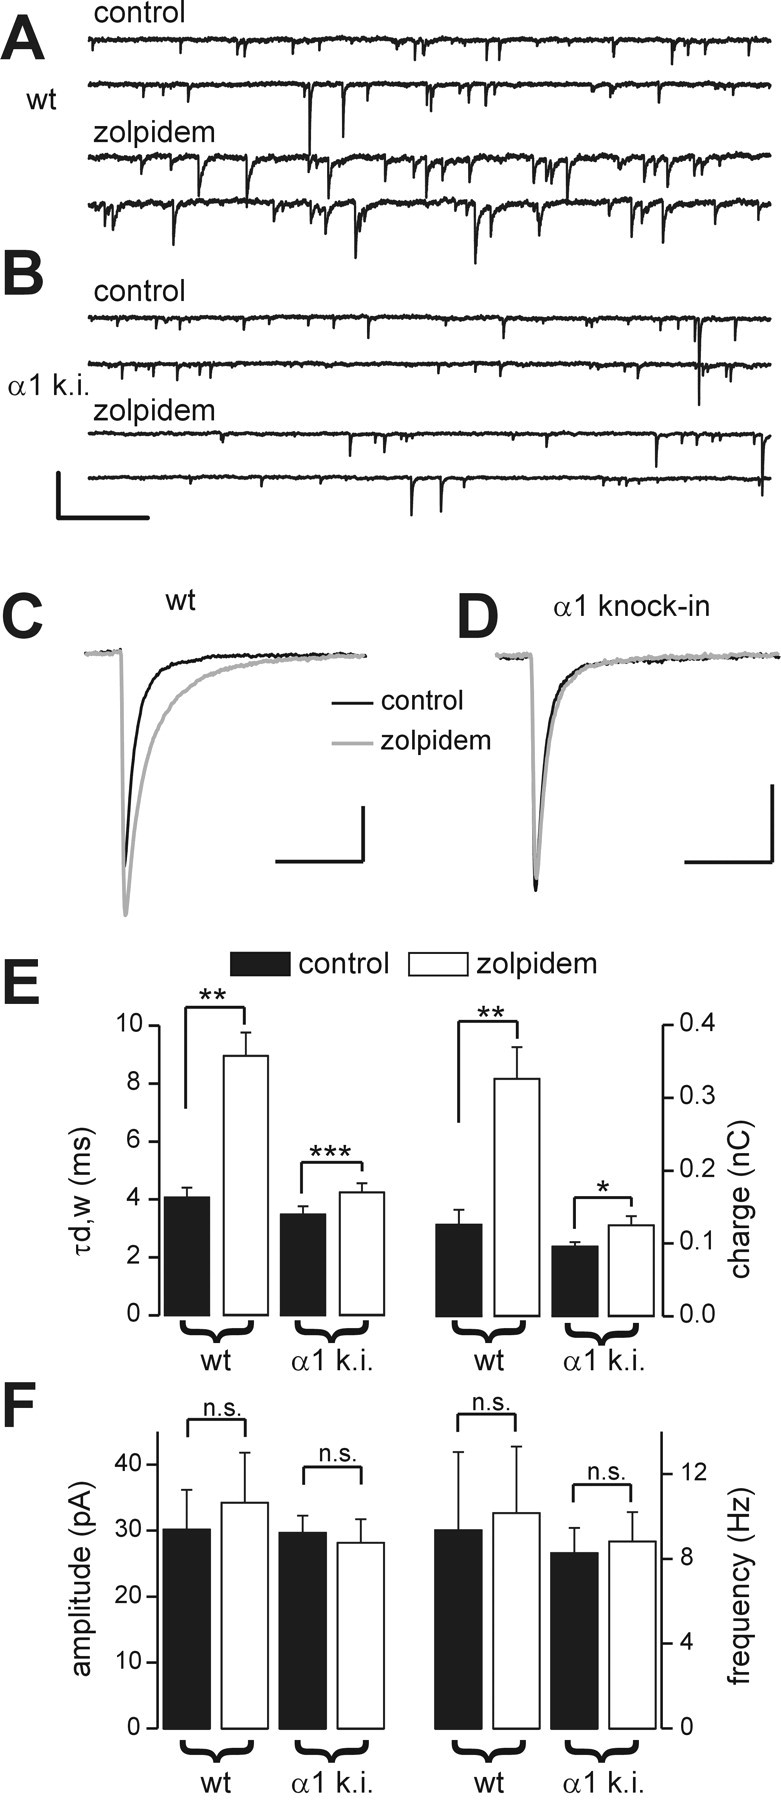
Locally projecting GABAergic interneurons are the major providers of inhibition in the neocortex and play a crucial role in several brain functions. Neocortical interneurons are connected via electrical and chemical synapses that may be crucial in modulating complex network oscillations. We investigated the properties of spontaneous and evoked IPSCs in two morphologically and physiologically identified interneuron subtypes, the fast-spiking (FS) and low threshold-spiking (LTS) cells in layer V of rodent sensorimotor cortex. We found that IPSCs recorded in FS cells were several orders of magnitude more frequent, larger in amplitude, and had faster kinetics than IPSCs recorded in LTS cells. GABA(A) receptor alpha- and beta-subunit selective modulators, zolpidem and loreclezole, had different effects on IPSCs in FS and LTS interneurons, suggesting differential expression of GABA(A) receptor subunit subtypes. These pharmacological data indicated that the alpha1 subunit subtype is poorly expressed by LTS cells but makes a large contribution to GABA(A) receptors on FS cells. This was confirmed by experiments performed in genetically modified mice in which the alpha1 subunit had been made insensitive to benzodiazepine-like agonists. These results suggest that differences in IPSC waveform are likely attributable to distinctive expression of GABA(A) receptor subunits in FS and LTS cells. The particular properties of GABAergic input on different interneuronal subtypes might have important consequences for generation and pacing of cortical rhythms underlying several brain functions. Moreover, selective pharmacological manipulation of distinct inhibitory circuits might allow regulation of pyramidal cell activities under specific physiological and pathophysiological conditions.


Figures

Figure 1.
Figure 1.
Different morphological and physiological properties of FS and LTS interneurons. A, A biocytin-filled and reconstructed FS interneuron in neocortical layer V. The cell body and dendrites are marked in red, and the axon is marked in blue. Note that the extensive axonal arborization in the perisomatic region is shown. B, Biocytin-filled and reconstructed LTS cell. The color code is the same as in A. Note that the less extensive axonal plexus around the cell body and the more prominent, vertically oriented, axonal arborization extending toward the more superficial cortical layers are shown. Inset, Plot of mean firing frequencies in response to injected currents of different amplitudes in FS (solid circles) and LTS (open circles) interneurons. Current injections were 600 msec. Note that the cell-specific difference in firing frequency at almost every current injection level is shown. C, Current-clamp recording of firing behavior of the cell in A. A depolarizing current injection (600 pA; 600 msec) evoked a high-frequency spike-firing pattern with little adaptation, and a hyperpolarizing current injection (-300 pA; 600 msec) did not elicit rebound spikes. D, Current-clamp recording of firing behavior of the cell in B. The cell responded with a rebound spike after a hyperpolarizing current injection (-300 pA; 600 msec; see also rebound burst response of LTS cell in Fig. 2 A) and a depolarizing pulse (500 pA; 600 msec) evoked action potentials with a lower frequency and a more evident spike frequency accommodation than the FS cell in A and C. Note that the pronounced spike afterhyperpolarization in the LTS interneuron is shown. VM, -65 (C), -60 mV (D).
Figure 2.
Figure 2.
Different decay properties of evoked GABAergic synaptic transmission in FS and LTS interneurons. A, Current-clamp recordings from an FS (left) and an LTS (right) interneuron that show responses to depolarization and hyperpolarization similar to those of the neurons in Figure 1, C and D. Current pulses (600 msec long), -300 and 500 pA (left), -300 and 300 pA (right). VM, -70 and -66 mV in the FS and LTS neurons, respectively. B, Extracellularly evoked IPSCs isolated in dl-APV (100 μm) and DNQX (10 μm) in the FS and LTS cells in A. The traces are the average of 20 individual suprathreshold responses in both cases. The gray lines are the double-exponential fits of the decay phases of mean synaptic responses. C, Traces of B, scaled to the peak amplitude and superimposed. Note that the large difference in the decay phases in the two interneuron species is shown. D, Graphs of average half-width (left) and τd,w (right) in FS (black bars; n = 19) and LTS (white bars; n = 16) interneurons (***p < 0.00005; **p < 0.004; independent t test).
Figure 3.
Figure 3.
FS and LTS interneurons show different sIPSC characteristics. A, B, Representative continuous recordings of sIPSCs from an FS (A) and an LTS (B) interneuron in dl-APV and DNQX. C, D, The GABAA receptor antagonist gabazine (10 μm) completely abolished spontaneous activity in both cell types. Calibration: (A-D) 100 pA, 200 msec. E, Cumulative distribution plots for sIPSC inter-event intervals, amplitudes, and half-widths in FS (solid lines) and LTS interneurons (dashed lines) in A and B. Note that the profound differences in sIPSC frequency, amplitude, and waveform are shown. Number of events in E: 2410 and 450 in FS and LTS, respectively.
Figure 4.
Figure 4.
Amplitude and kinetic properties of sIPSCs in FS and LTS interneurons. A, Left, Superimposed traces of averaged sIPSCs recorded from FS and LTS cells in Figure 2, A and B. (FS: n = 230 events; LTS: n = 180 events). A, Right, The same averaged traces scaled to the peak of the mean FS current response. Note that the large difference in decay phases in the two interneuron subtypes is shown. B, Graphs of the average sIPSC amplitude (left) and frequency (right) in FS (black bars; n = 17) and LTS (white bars; n = 17) interneurons. C, Graphs of the average sIPSC weighted decay time constant (τd,w; left) and rise time (right) in FS (black bars) and LTS (white bars) interneurons (n = 17 in both cell types for τd,w; n = 9 in both cell types for the rise time; ***p < 0.0002; **p < 0.002; independent t test; n.s., difference not statistically significant). On average, FS interneurons have faster, larger amplitude and more frequent sIPSCs than LTS cells; however, rise times are not different.
Figure 5.
Figure 5.
Effects of loreclezole on sIPSCs in FS interneurons. A, Representative traces of sIPSCs recorded from an FS interneuron in control (top traces) and in the presence of 10 μm loreclezole (bottom traces). Loreclezole greatly increased IPSC duration. B, Superimposed averaged sIPSC traces in control (n = 230) and in loreclezole (n = 250) for the cell in A. C, Cumulative probability distribution of sIPSC half-width (left; 277 events in control; 268 events in loreclezole) and 90% decay (right; 277 events in control; 268 events in loreclezole) for the cell in A. Solid lines, Control (ctr); dashed lines, loreclezole (LCZ). D, Graphs of sIPSC weighed decay time constant (τd,w), charge, amplitude, and frequency in all cells tested. Lines connect values in each cell before and after loreclezole. ***p < 0.0004; **p < 0.004; *p < 0.05; n.s., no significant difference; paired t test. E, Time course of the effect of loreclezole on sIPSC 90% decay time in an FS interneuron. Each dot represents an individual IPSC. The black bar indicates the time of drug application. Note the relative fast onset of the loreclezole-mediated effect and partial reversal during the wash-out.
Figure 6.
Figure 6.
Effect of loreclezole on sIPSCs in LTS interneurons. A, Representative traces of sIPSCs recorded from an LTS interneuron in control (top traces) and in the presence of 10 μm loreclezole (bottom traces). Loreclezole increased IPSC durations. B, Superimposed averaged sIPSC traces in control (n = 200) and loreclezole (n = 180). C, Cumulative probability distribution of sIPSC half-width (left) and 90% decay (right) for the cell in A, in control (ctr; solid lines) and in the presence of loreclezole (LCZ; dashed lines). There were 191 and 248 events in control and loreclezole, respectively. D, Graphs of sIPSC weighted decay time constant (τd,w), charge, amplitude, and frequency in all cells tested in control and loreclezole. Lines connect values before and after loreclezole in each neuron. *p < 0.02; n.s., no significant difference; paired t test.
Figure 7.
Figure 7.
Effects of zolpidem on sIPSCs in FS interneurons. A, Representative traces of sIPSCs recorded from an FS interneuron in control (top continuous traces) and in the presence of 200 nm zolpidem (bottom traces). Zolpidem increased IPSC duration. B, Superimposed averaged sIPSC traces in control (n = 300) and in loreclezole (n = 300). C, Cumulative probability distribution of sIPSC half-width (left) and 90% decay (right) for the FS cell in A, in control (ctr; solid lines) and in the presence of zolpidem (ZOLP; dashed lines). There were 437 and 438 events in control and zolpidem, respectively. D, Graphs of sIPSC weighted decay time constant (τd,w), charge, amplitude, and frequency in all cells tested in control and zolpidem. Lines connect values before and after zolpidem in each neuron. **p < 0.005; *p < 0.05; n.s., no significant difference; paired t test.
Figure 8.
Figure 8.
Effects of zolpidem on sIPSCs in LTS interneurons. A, Representative traces of sIPSCs recorded from an LTS interneuron in control (top traces) and in the presence of 200 nm zolpidem (bottom traces). Zolpidem did not modify IPSC waveform. B, Superimposed averaged sIPSC traces in control (black trace; n = 150) and in zolpidem (gray trace; n = 150). C, Cumulative probability distribution of sIPSC half-width (left) and 90% decay (right) for the LTS cell in A, in control (ctr; solid lines) and in the presence of zolpidem (ZOLP; dashed lines). There were 79 and 76 events in control and zolpidem, respectively. D, Graphs of sIPSC weighted decay time constant (τd,w), charge, amplitude, and frequency in all cells tested in control and zolpidem. Lines connect values before and after zolpidem in each neuron. n.s., No significant difference; paired t test. E, Graphs showing the mean relative change in sIPSC charge produced by 200 nm zolpidem (left) and 10 μm loreclezole (right) in FS (white bars) and LTS interneurons (black bars). Each drug produced significantly different modulation in the two cell types (**p < 0.01; independent t test).
Figure 9.
Figure 9.
Effects of zolpidem on sIPSCs in FS interneurons of wild-type and α1(H101R) knock-in mice. A, Representative traces of sIPSCs recorded from an FS interneuron in a wild-type (wt) mouse in control (top traces) and in the presence of zolpidem (bottom traces). B, Representative traces of sIPSCs recorded from an FS interneuron in a mutated mouse (α1 k.i.) in control (top traces) and in the presence of 200 nm zolpidem (bottom traces). Calibration: (A, B) 200 pA, 500 msec. C, Superimposed averaged sIPSC traces in control (black trace; n = 280) and in zolpidem (gray trace; n = 310) in the wild-type mouse (same cell as in A). Calibration: 10 pA, 20 msec. D, Superimposed averaged sIPSC traces in control (black trace; n = 300) and in zolpidem (gray trace; n = 325) in the α1 knock-in mouse (same cell as in B). Calibration: 10 pA, 20 msec. E, Graphs of mean sIPSC τd,w (left) and charge (right) in wild-type and α1 knock-in (α1 k.i.) mice in control (black bars) and in the presence of zolpidem (white bars). ***p < 0.001; **p < 0.01; *p < 0.05; paired t test. F, Graphs of mean sIPSC amplitude (left) and frequency (right) in wild-type and α1 knock-in mice in control (black bars) and in the presence of zolpidem (white bars). n.s., No significant difference; paired t test; n = 4 and 9 for wild-type and α1 knock-in mice, respectively.

References

    1. Bacci A, Huguenard JR, Prince DA ( 2002) Differential modulation of synaptic transmission by neuropeptide Y in rat neocortical neurons. Proc Natl Acad Sci USA 99: 17125-17130. - PMC - PubMed
    1. Bacci A, Huguenard JR, Prince DA ( 2003) Functional autaptic neurotransmission in fast-spiking interneurons: a novel form of feedback inhibition in the neocortex. J Neurosci 23: 859-866. - PMC - PubMed
    1. Banks MI, Li TB, Pearce RA ( 1998) The synaptic basis of GABAA, slow. J Neurosci 18: 1305-1317. - PMC - PubMed
    1. Banks MI, Hardie JB, Pearce RA ( 2002) Development of GABA(A) receptor-mediated inhibitory postsynaptic currents in hippocampus. J Neurophysiol 88: 3097-3107. - PubMed
    1. Bartos M, Vida I, Frotscher M, Geiger JR, Jonas P ( 2001) Rapid signaling at inhibitory synapses in a dentate gyrus interneuron network. J Neurosci 21: 2687-2698. - PMC - PubMed

Publication types

MeSH terms

LinkOut - more resources