. 2003 Oct 22;23(29):9687-95.
doi: 10.1523/JNEUROSCI.23-29-09687.2003.

Sleep deprivation causes behavioral, synaptic, and membrane excitability alterations in hippocampal neurons

Affiliations

Sleep deprivation causes behavioral, synaptic, and membrane excitability alterations in hippocampal neurons

Carmel M McDermott et al. J Neurosci. .

Abstract

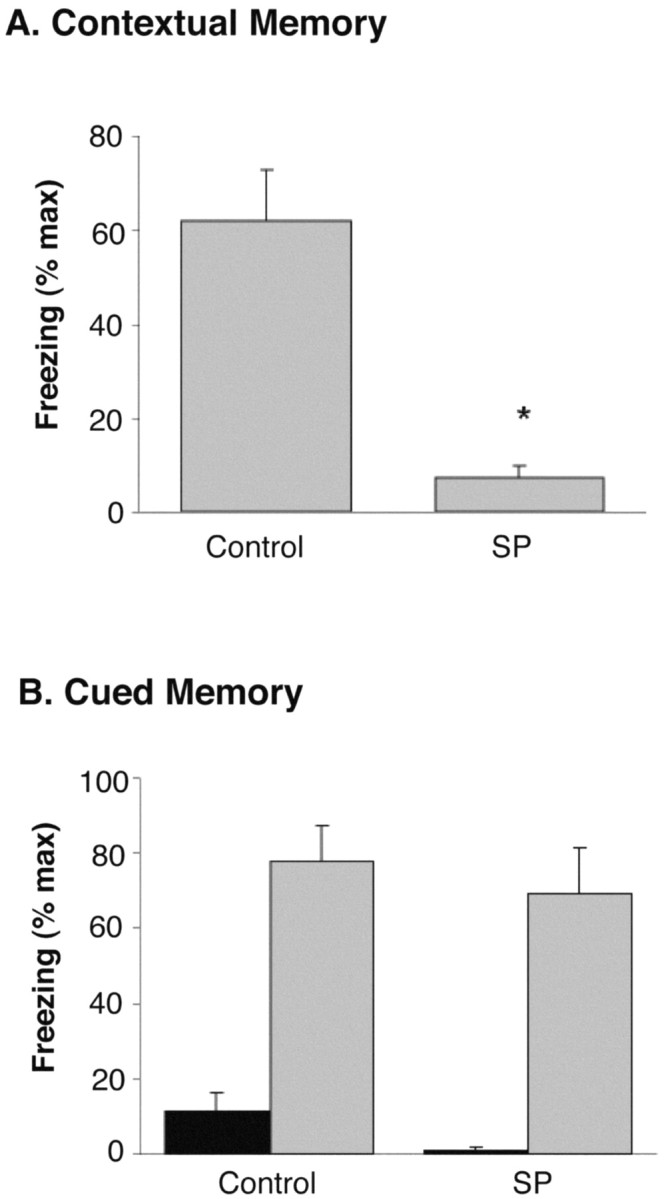
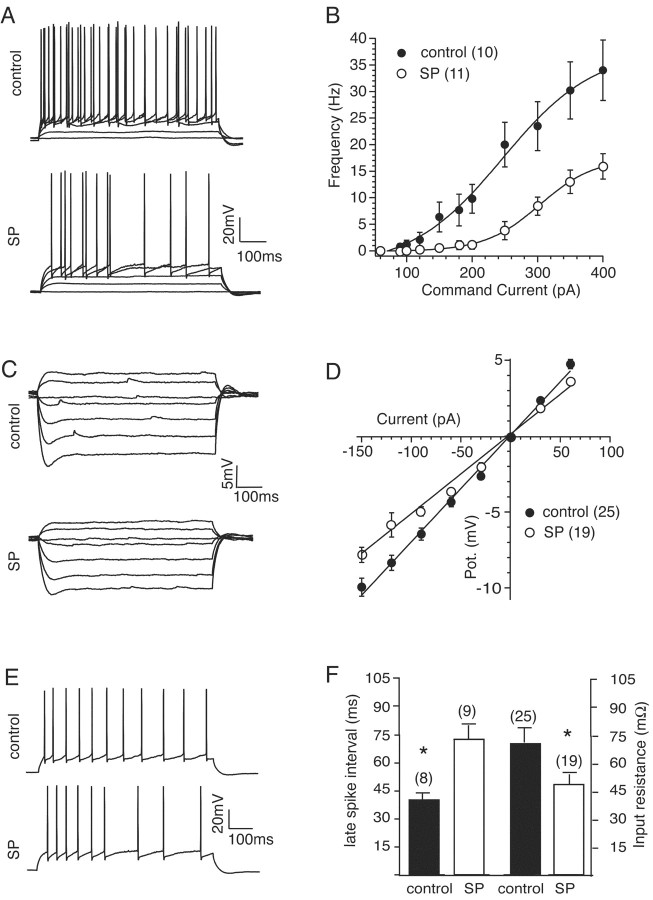
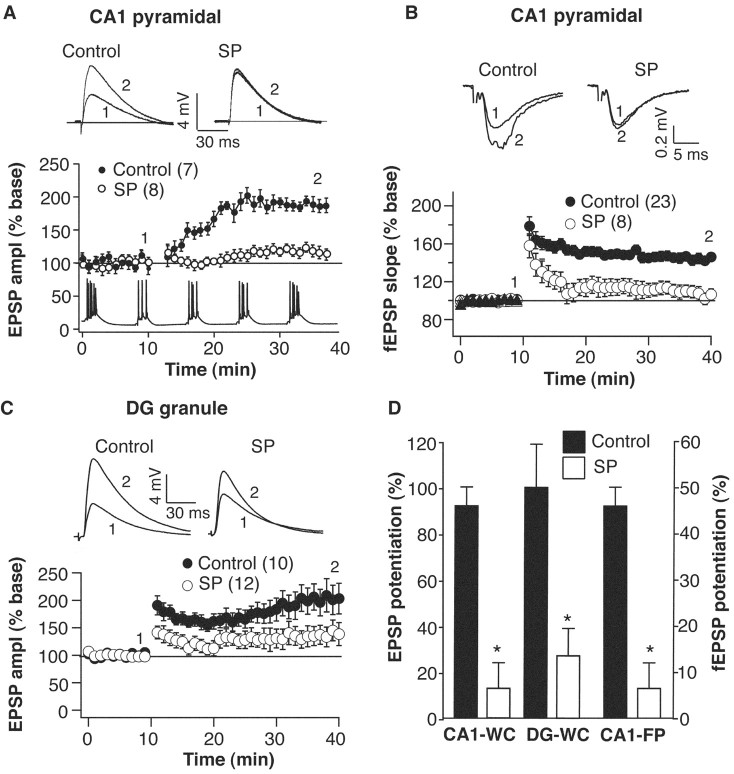
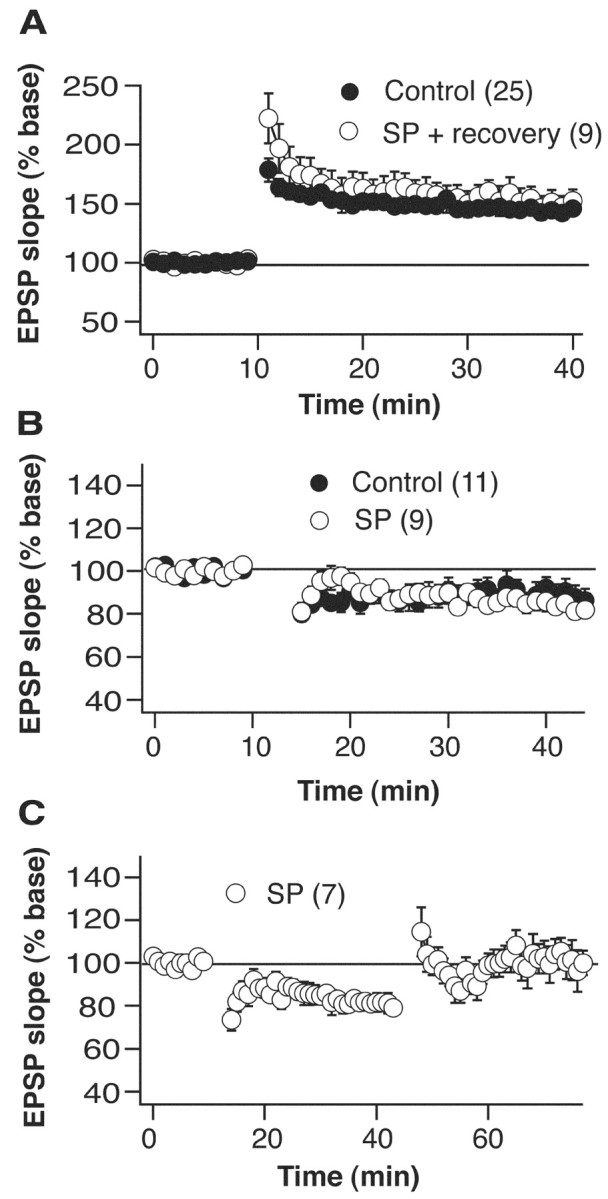
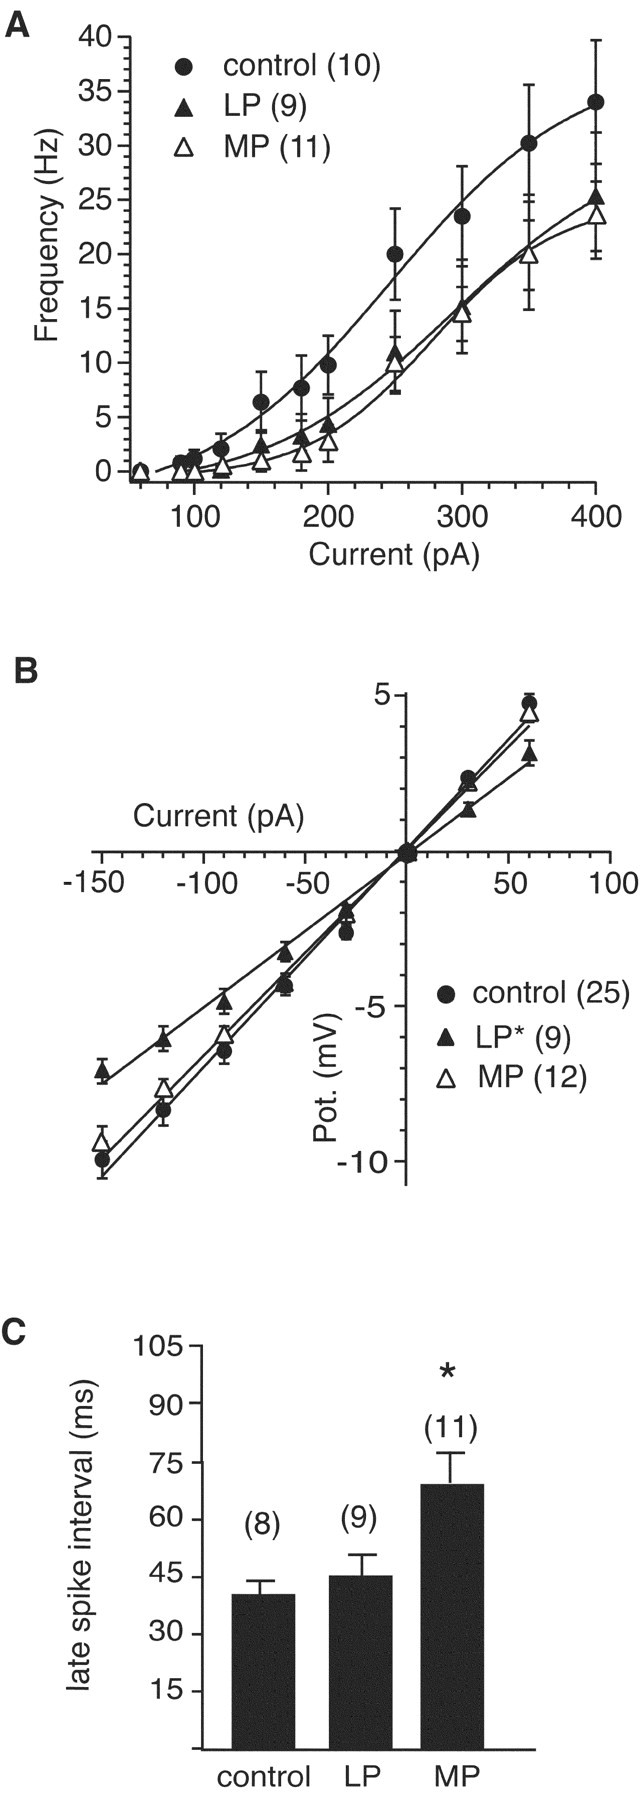
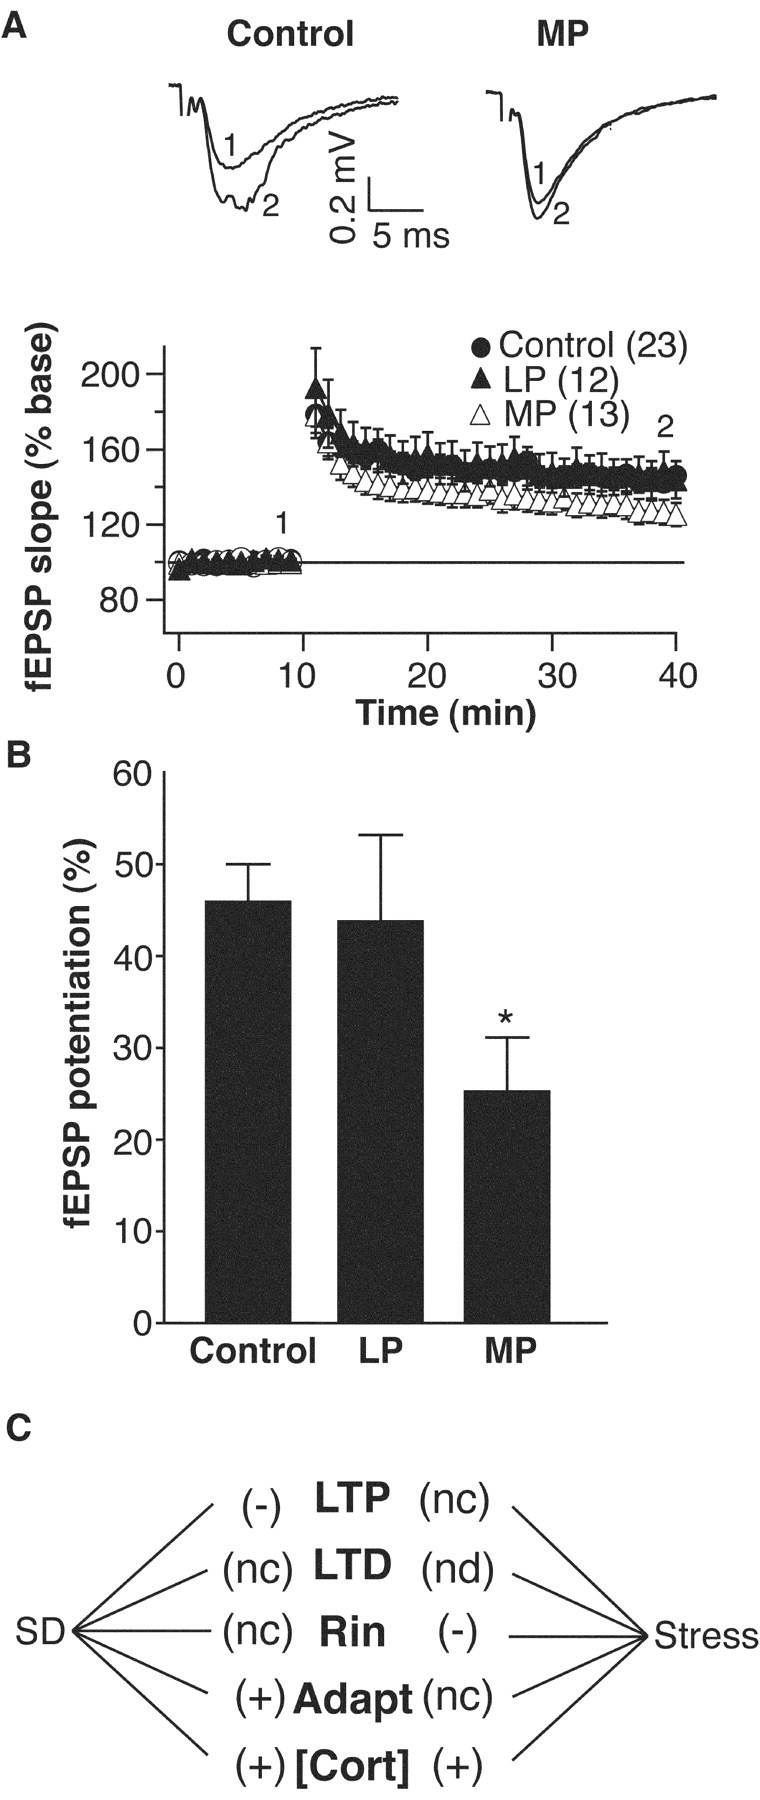
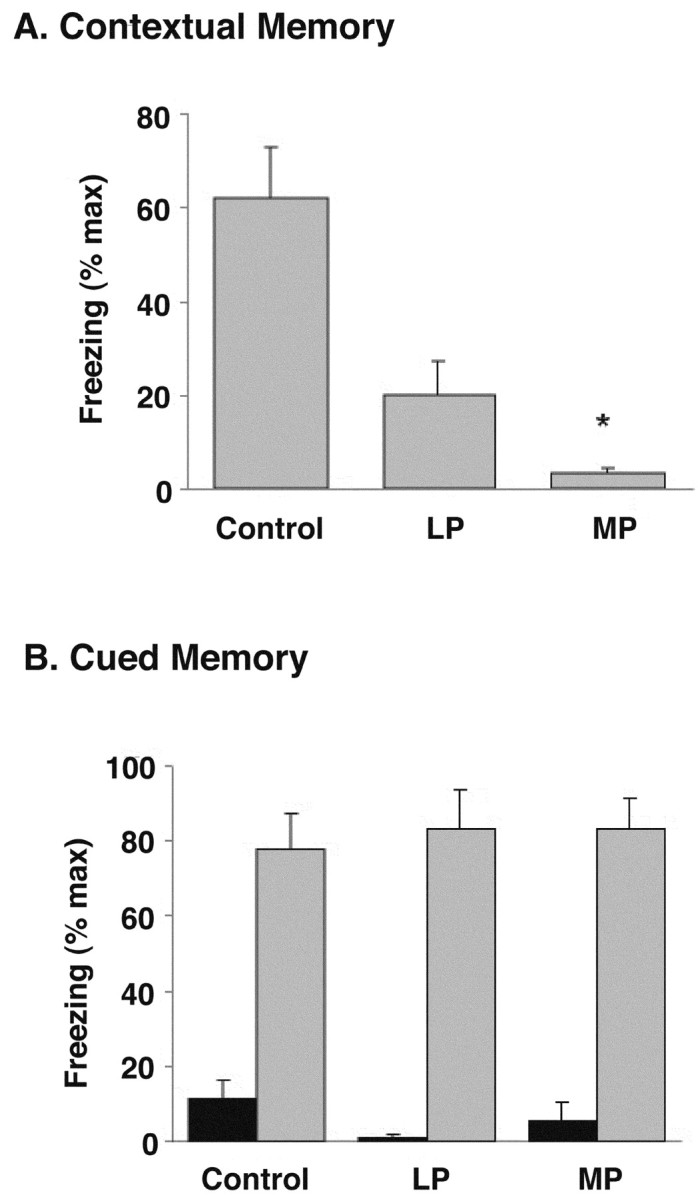
Although the function of sleep remains elusive, several lines of evidence suggest that sleep has an important role in learning and memory. In light of the available data and with the prevalence of sleep deprivation (SD), we sought to determine the effect of SD on neuronal functioning. We found that the exposure of rats to 72 hr of primarily rapid eye movement SD impaired their subsequent performance on a hippocampus-dependent spatial learning task but had no effect on an amygdala-dependent learning task. To determine the underlying cellular level mechanisms of this hippocampal deficit, we examined the impact of SD on several fundamental aspects of membrane excitability and synaptic physiology in hippocampal CA1 pyramidal neurons and dentate gyrus granule cells. We found that neuronal excitability was severely reduced in CA1 neurons but not in granule cells and that the production of long-term potentiation of synaptic strength was inhibited in both areas. Using multiple SD methods we further attempted to differentiate the effects of sleep deprivation from those associated with the nonspecific stress induced by the sleep deprivation methods. Together these data suggest that failure to acquire adequate sleep produces several molecular and cellular level alterations that profoundly inhibit hippocampal functioning.


Figures

Figure 1.
Figure 1.
Effects of 72 hr SD on hippocampus-mediated (A) and amygdala-mediated (B) memory. Y-axes show the mean (±SEM) amount of freezing as percentage of maximum (% max) possible for each group. A, Freezing in the context in which tone--shock pairings occurred 24 hr before test was normal in controls (n = 9) but significantly (*p < 0.001) reduced in rats that were sleep deprived for 72 hr by the single small platform method (n = 9). (Data were collapsed over the 6 min test period, during which no tones or shocks were delivered.) B, Freezing in a novel environment before (black bars) and after (gray bars) presentation of the cue (tone) that had been paired previously with shock was equivalent between control and SP rats. No shock was presented during this test.
Figure 2.
Figure 2.
Neuronal excitability is reduced after sleep deprivation. A, Frequency of firing is dramatically reduced after sleep deprivation. Membrane potential in response to current injections ranging from 0 to 350 pA (top) for control and 0 to 400 pA for SP (bottom). B, Summary frequency-current plot shows that firing is markedly reduced in the SP group compared with controls. C, Membrane potential in response to current injections ranging from -210 to 60 pA (30 pA steps) for control (top) and SP neurons (bottom). D, Summary current-voltage plots showing that Rin is reduced in SP neurons. E, Spike frequency adaptation is enhanced in SP neurons. Representative traces showing membrane potential from a control (top) and an SP neuron (bottom) in response to 300 pA current injections to both cells. F, Summary plots of adaptation (mean interval for spikes in the final 350 msec of the current step) and input resistance. The SP group has an enhanced adaptation and reduced input resistance compared with the control group. To normalize for the differences in Rin, mean intervals were calculated from 350 pA injections in the control group and 400 pA injections in the SP group. *p < 0.01, compared with control group. In all plots the number of cells in each group is given in parentheses.
Figure 3.
Figure 3.
LTP is inhibited in hippocampal slices after sleep deprivation. A, Top, Representative somatic EPSPs recorded in vitro from CA1 cells in response to Schaffer collateral stimulation. Bottom, Normalized averages of EPSP amplitudes (EPSP ampl) from control and small platform sleep-deprived rats. Theta-like stimulation of Schaffer collaterals occurred at the 10 min time point. Inset, Example of theta-like stimulation used to induce LTP. B, Top, Representative CA1 field potentials recorded in vitro from control and small platform sleep-deprived rats after Schaffer collateral stimulation. Bottom, Grouped data showing normalized field EPSP slope from both groups. LTP induction (2 × 100 Hz × 1 sec; 30 sec interval) occurred at the 10 min time point. C, Top, Representative EPSPs recorded from dentate granule cells in response to medial-lateral perforant path stimulation. Bottom, Normalized averages of EPSP amplitudes from control and SP rats. Theta-like stimulation of perforant path occurred at the 10 min time point. All waveforms are an average of 10 consecutive traces. D, Summary of LTP induction in hippocampal slices (mean ± SEM) from control and small platform sleep-deprived rats. We calculated potentiation by dividing the average EPSP slope-amplitude at 30 min after tetanus by the baseline average. *p < 0.01, compared with control group. In all plots the number of cells in each group is given in parentheses. WC, Whole cell; DG, dentate gyrus; FP, field potential.
Figure 4.
Figure 4.
LTP is recoverable and LTD is unaffected. A, Twenty-four hour recovery after 72 hr single platform sleep-deprivation restores LTP to control levels. Tetanus, 100 Hz (2 × 1 sec, 30 sec interval), occurred at the 10 min time point. B, LTD is unaffected by 72 hr of small platform sleep deprivation. LTD induction (5 min × 3 Hz) occurred at the 10 min time point. C, Giving LTD before LTP induction does not rescue LTP in rats sleep deprived on the small platform. LTD induction occurred at the 10 min time point, and LTP induction occurred at the 45 min time point. Graphs represent grouped data showing normalized fEPSP slope. In all plots the number of cells in each group is given in parentheses.
Figure 5.
Figure 5.
Neuronal excitability shows treatment-specific effects. A, Summary frequency-current plot shows that firing is reduced in both the LP and MP groups, compared with controls. B, Summary current-voltage plots show that Rin is reduced in neurons from the LP group but not in neurons from the MP group. C, Summary plots of adaptation (mean interval for spikes in the final 350 msec of the current step) show that the MP group has enhanced adaptation compared with the control and LP groups. To normalize for the differences in Rin, mean intervals were calculated from 350 pA injections in the control and MP groups and 400 pA injections in the LP group. Significantly different (p < 0.05) groups are as indicated. In all plots the number of cells in each group is given in parentheses.
Figure 6.
Figure 6.
A, Top, Representative CA1 field potentials recorded in vitro from control and multiple platform sleep-deprived rats after Schaffer collateral stimulation. Bottom, Grouped data showing normalized field EPSP slope from control, MP, and LP groups. LTP induction (2 × 100 Hz × 1 sec; 30 sec interval) occurred at the 10 min time point. B, Summary of EPSP slope LTP (mean ± SEM) for control, MP, and LP groups. We calculated potentiation by dividing the average EPSP slope at 30 min after tetanus by the average baseline EPSP slope. *p < 0.05, compared with control group. In all plots the number of cells in each group is given in parentheses. C, Summary sketch showing the differential effects of sleep deprivation versus stress on various synaptic and membrane properties of CA1 hippocampal cells. nd, Not determined; nc, not changed; Rin, input resistance.
Figure 7.
Figure 7.
Effects of 72 hr SD on hippocampus-mediated (A) and amygdala-mediated (B) memory. Y-axes show the mean (±SEM) amount of freezing as percentage of maximum (% max) possible for each group. A, Freezing in the context in which tone-shock pairings occurred 24 hr before test was significantly (*p < 0.001) reduced in rats sleep deprived for 72 hr by the MP method (n = 9). Freezing in rats placed on the LP for 72 hr (n = 7) was intermediate between that of control (n = 9) and MP rats and not significantly different from either group. (Data were collapsed over the 6 min test period, during which no tones or shocks were delivered.) B, Freezing in a novel environment before (black bars) and after (gray bars) presentation of the cue (tone) that had been paired previously with shock was equivalent among all treatment groups. No shock was presented during this test.

References

    1. Blank T, Nijholt I, Eckart K, Spiess J ( 2002) Priming of long-term potentiation in mouse hippocampus by corticotrophin-releasing factor and acute stress: implications for hippocampus-dependent learning. J Neurosci 22: 3788-3794. - PMC - PubMed
    1. Bliss TVP, Collingridge GL ( 1993) A synaptic model of memory: long-term potentiation in the hippocampus. Nature 361: 31-39. - PubMed
    1. Bramham CR, Southard T, Ahlers ST, Sarvey JM ( 1998) Acute cold stress leading to elevated corticosterone neither enhances synaptic efficacy nor impairs LTP in the dentate gyrus of freely moving rats. Brain Res 789: 245-255. - PubMed
    1. Buzsaki G ( 1998) Memory consolidation during sleep: a neurophysiological perspective. J Sleep Res 7: 17-23. - PubMed
    1. Chen K, Aradi I, Thon N, Eghbal-Ahmadi M, Baram TZ, Soltesz I ( 2001) Persistently modified h-channels after complex febrile seizures convert the seizure-induced enhancement of inhibition to hyperexcitability. Nat Med 7: 331-337. - PMC - PubMed

Publication types

MeSH terms

LinkOut - more resources