

Evidence for a novel gene expression program in peripheral blood mononuclear cells from Mycobacterium avium subsp. paratuberculosis-infected cattle
- PMID: 14573671
- PMCID: PMC219592
- DOI: 10.1128/IAI.71.11.6487-6498.2003
Evidence for a novel gene expression program in peripheral blood mononuclear cells from Mycobacterium avium subsp. paratuberculosis-infected cattle
Abstract
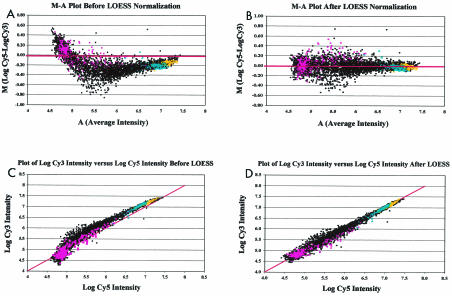
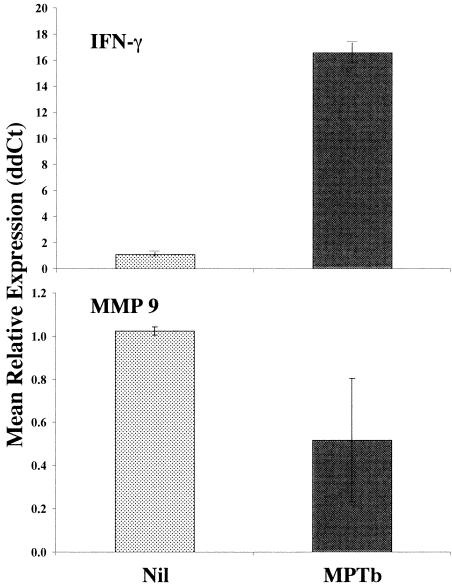
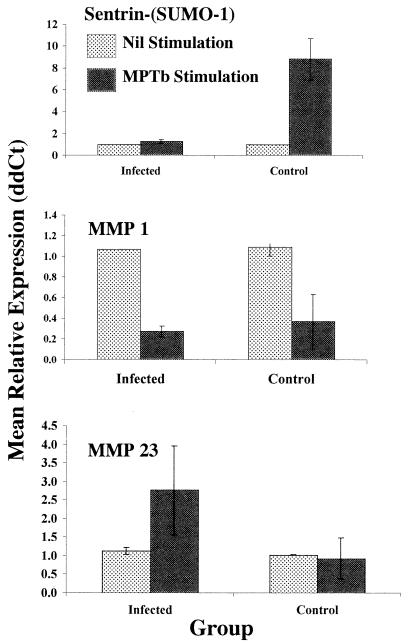
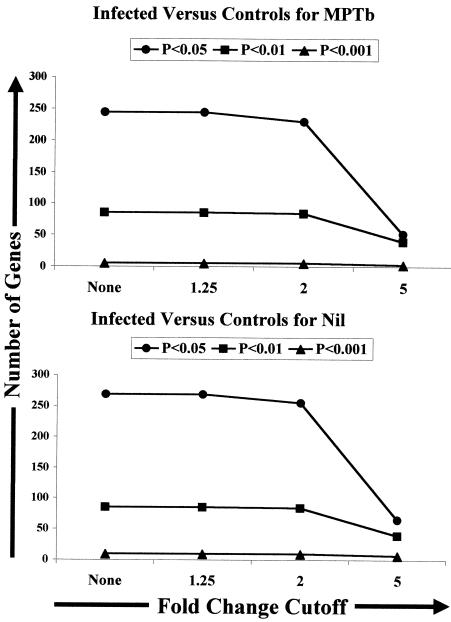
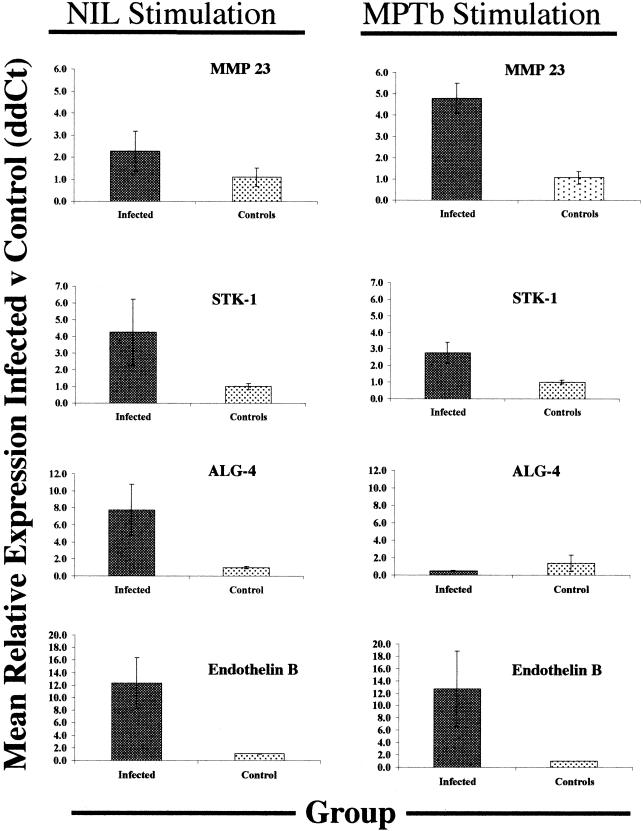
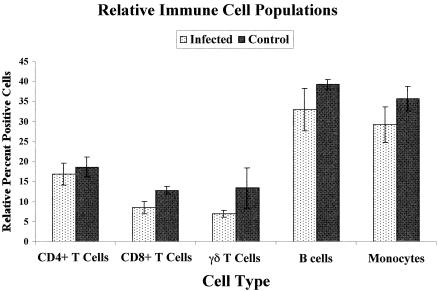
A bovine-specific cDNA microarray system was used to compare gene expression profiles of peripheral blood mononuclear cells (PBMCs) from control uninfected (n = 4) and Johne's disease-positive (n = 6) Holstein cows. Microarray experiments were designed so that for each animal, a direct comparison was made between PBMCs stimulated in vitro with Mycobacterium avium subsp. paratuberculosis and PBMCs stimulated with phosphate-buffered saline (nil-stimulated PBMCs). As expected, M. avium subsp. paratuberculosis stimulation of infected cow PBMCs enhanced expression of gamma interferon transcripts. In addition, expression of 15 other genes was significantly affected (>1.25-fold change; P < 0.05) by in vitro stimulation with M. avium subsp. paratuberculosis. Similar treatment of control cow PBMCs with M. avium subsp. paratuberculosis resulted in significant changes in expression of 13 genes, only 2 of which were also affected in PBMCs from the infected cow PBMCs. To compare gene expression patterns in the two cow infection groups (infected cows and uninfected cows), a mixed-model analysis was performed with the microarray data. This analysis indicated that there were major differences in the gene expression patterns between cells isolated from the two groups of cows, regardless of in vitro stimulation. A total of 86 genes were significantly differentially expressed (P < 0.01) in M. avium subsp. paratuberculosis-stimulated PBMCs from infected cows compared to expression in similarly treated PBMCs from control cows. Surprisingly, a larger number of genes (110 genes) were also found to be significantly differentially expressed (P < 0.01) in nil-stimulated cells from the two infection groups. The expression patterns of selected genes were substantiated by quantitative real-time reverse transcriptase PCR. Flow cytometric analysis indicated that there were no gross differences in the relative populations of major immune cell types in PBMCs from infected and control cows. Thus, data presented in this report indicate that the gene expression program of PBMCs from M. avium subsp. paratuberculosis-infected cows is inherently different from that of cells from control uninfected cows.
Figures
Similar articles
-
Gene expression profiling of peripheral blood mononuclear cells from cattle infected with Mycobacterium paratuberculosis.Infect Immun. 2002 Oct;70(10):5494-502. doi: 10.1128/IAI.70.10.5494-5502.2002. Infect Immun. 2002. PMID: 12228275 Free PMC article.
-
Cytokine gene expression in peripheral blood mononuclear cells and tissues of cattle infected with Mycobacterium avium subsp. paratuberculosis: evidence for an inherent proinflammatory gene expression pattern.Infect Immun. 2004 Mar;72(3):1409-22. doi: 10.1128/IAI.72.3.1409-1422.2004. Infect Immun. 2004. PMID: 14977946 Free PMC article.
-
Johne's disease in cattle is associated with enhanced expression of genes encoding IL-5, GATA-3, tissue inhibitors of matrix metalloproteinases 1 and 2, and factors promoting apoptosis in peripheral blood mononuclear cells.Vet Immunol Immunopathol. 2005 May 15;105(3-4):221-34. doi: 10.1016/j.vetimm.2005.02.009. Vet Immunol Immunopathol. 2005. PMID: 15808302
-
Rapid and transient activation of gene expression in peripheral blood mononuclear cells from Johne's disease positive cows exposed to Mycobacterium paratuberculosis in vitro.Microb Pathog. 2004 Feb;36(2):93-108. doi: 10.1016/j.micpath.2003.09.007. Microb Pathog. 2004. PMID: 14687562
-
Tactics of Mycobacterium avium subsp. paratuberculosis for intracellular survival in mononuclear phagocytes.J Vet Sci. 2008 Mar;9(1):1-8. doi: 10.4142/jvs.2008.9.1.1. J Vet Sci. 2008. PMID: 18296882 Free PMC article. Review.
Cited by
-
Model for immune responses to Mycobacterium avium subspecies paratuberculosis in cattle.Infect Immun. 2004 Jun;72(6):3089-96. doi: 10.1128/IAI.72.6.3089-3096.2004. Infect Immun. 2004. PMID: 15155609 Free PMC article. Review. No abstract available.
-
Cytokine responses of bovine macrophages to diverse clinical Mycobacterium avium subspecies paratuberculosis strains.BMC Microbiol. 2006 Feb 14;6:10. doi: 10.1186/1471-2180-6-10. BMC Microbiol. 2006. PMID: 16478544 Free PMC article.
-
Molecular analyses of disease pathogenesis: application of bovine microarrays.Vet Immunol Immunopathol. 2005 May 15;105(3-4):277-87. doi: 10.1016/j.vetimm.2005.02.015. Vet Immunol Immunopathol. 2005. PMID: 15808306 Free PMC article. Review.
-
Gene-expression profiling of calves 6 and 9 months after inoculation with Mycobacterium avium subspecies paratuberculosis.Vet Res. 2014 Oct 2;45(1):96. doi: 10.1186/s13567-014-0096-5. Vet Res. 2014. PMID: 25294045 Free PMC article.
-
Mycobacterium Avium subsp. paratuberculosis isolates induce in vitro granuloma formation and show successful survival phenotype, common anti-inflammatory and antiapoptotic responses within ovine macrophages regardless of genotype or host of origin.PLoS One. 2014 Aug 11;9(8):e104238. doi: 10.1371/journal.pone.0104238. eCollection 2014. PLoS One. 2014. PMID: 25111300 Free PMC article.
References
-
- Adams, J. L., and C. J. Czuprynski. 1994. Mycobacterial cell wall components induce the production of TNF-alpha, IL-1, and IL-6 by bovine monocytes and the murine macrophage cell line RAW 264.7. Microb. Pathog. 16:401-411. - PubMed
-
- Alzuherri, H. M., C. J. Woodall, and C. J. Clarke. 1996. Increased intestinal TNF-alpha, IL-1 beta and IL-6 expression in ovine paratuberculosis. Vet. Immunol. Immunopathol. 49:331-345. - PubMed
-
- Billman-Jacobe, H., M. Carrigan, F. Cockram, L. A. Corner, I. J. Gill, J. F. Hill, T. Jessep, A. R. Milner, and P. R. Wood. 1992. A comparison of the interferon gamma assay with the absorbed ELISA for the diagnosis of Johne's disease in cattle. Aust. Vet. J. 69:25-28. - PubMed
-
- Burrells, C., C. J. Clarke, A. Colston, J. M. Kay, J. Porter, D. Little, and J. M. Sharp. 1999. Interferon-gamma and interleukin-2 release by lymphocytes derived from the blood, mesenteric lymph nodes and intestines of normal sheep and those affected with paratuberculosis (Johne's disease). Vet. Immunol. Immunopathol. 68:139-148. - PubMed
-
- Burrells, C., C. J. Clarke, A. Colston, J. M. Kay, J. Porter, D. Little, and J. M. Sharp. 1998. A study of immunological responses of sheep clinically-affected with paratuberculosis (Johne's disease). The relationship of blood, mesenteric lymph node and intestinal lymphocyte responses to gross and microscopic pathology. Vet. Immunol. Immunopathol. 66:343-358. - PubMed
Publication types
MeSH terms
LinkOut - more resources
Full Text Sources
Other Literature Sources
Research Materials
