Comparative Study
. 2003 Nov;5(4):243-9.
doi: 10.1016/S1525-1578(10)60481-3.

Comparison of GenFlex Tag array and Pyrosequencing in SNP genotyping

Affiliations
Comparative Study

Comparison of GenFlex Tag array and Pyrosequencing in SNP genotyping

Daniel C Chen et al. J Mol Diagn. 2003 Nov.

Abstract

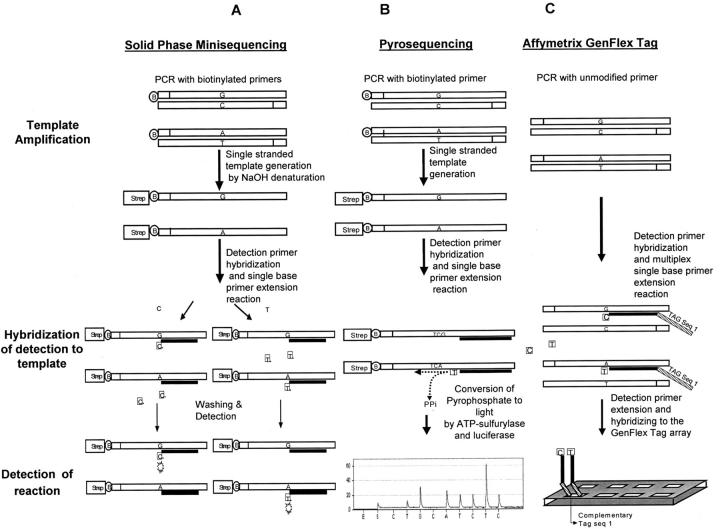
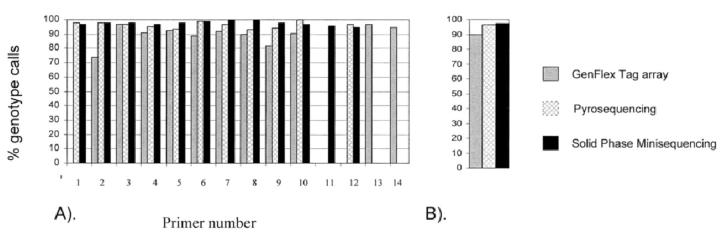
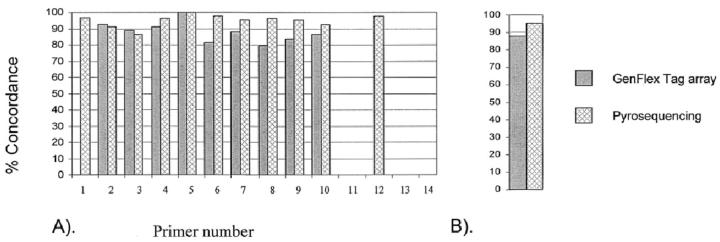
With the completion of the Human Genome Project, over 2 million sequence-verified single nucleotide polymorphisms (SNPs) have been deposited in public databases. The challenge has shifted from SNP identification to high-throughput SNP genotyping. Although this has had little impact on molecular diagnostics, it provides the potential for future molecular diagnostics of complex traits to include SNP profiling. Accordingly, efficient, accurate, and flexible SNP genotyping are needed. In addition, the drive for low cost has pushed genotyping reactions toward multiplexing capability. We compared two SNP genotyping techniques: Affymetrix GenFlex Tag array and Pyrosequencing. The reference method was a well-established, solid-phase, single nucleotide extension reaction technique based on tritium detection. Fourteen SNPs were selected from the fine mapping project of a multiple sclerosis locus on chromosome 17q. Using all three techniques and the reference method, the SNPs were analyzed in 96 related individuals. Without extensive optimization, we successfully genotyped 11 of 14 SNPs with both GenFlex and Pyrosequencing. Our study suggests that the Pyrosequencing technique provides higher accuracy between the two systems which is most likely due to the single-stranded template in the extension reaction. Thus, Pyrosequencing has potential for diagnostic applications. Pyrosequencing, however, is not optimal for large SNP profiling analyses wherein multiplexing potential is an advantage.


Figures

Figure 1.
Figure 1.
Reaction chemistry of the 3 SNP genotyping systems tested. A: In solid-phase minisequencing, PCR is performed using biotinylated primers. The biotinylated PCR product is captured to a streptavidin (Strep)-coated, solid-phase (eg, microtitration plate), and denatured. The unbound strand is washed away from the reaction solution. A single nucleotide extension reaction using 3H deoxynucleotides is performed on the captured, single-stranded template. B: In Pyrosequencing, the PCR is performed using biotinylated primers and captured to a solid-phase (beads), similar to minisequencing. Yet the beads provide a much greater binding capacity than streptavidin-coated microtitration plates. The unbound strand is washed away. A four enzyme sequencing reaction, for a stretch of 4 to 5 consecutive nucleotides, is performed. Each nucleotide extension releases pyrophosphate. C: In the Tag-Array format, the PCR is performed using regular primers, but the denatured PCR product is captured by hybridization to oligonucleoties which have a Tag sequence as a tail. This tail sequence is complementary to a specific oligonucleotide Tag’s on the array. The primer extension reaction is performed using differently labeled fluorescent dideoxynucleotides.
Figure 2.
Figure 2.
The proportion of genotype calls for each SNP assay platform. A: The height of the bar represents the percentage of successful calls of 96 DNA samples for each SNP. Thus a low bar indicates that a large fraction of samples could not be reliably genotyped. The color coding of the bars indicate the assay platform. A lack of a bar indicates a non-working assay. B: The proportion of successful genotype calls expressed as a mean for all 14 SNPs combined. Color coding as in A.
Figure 3.
Figure 3.
Concordance of SNP genotypes from three analysis methods with the reference method. Number of SNPs corresponds to number in Table 2 . A: Height of the bars expresses the percentage of concordance of genotypes for each SNP with the reference method (minisequencing) genotype. The color coding of the bars indicate the assay platform. A lack of a bar indicates a non-working assay. B: The mean concordance of genotypes for all 14 SNPs combined for each platform, compared to the reference method. Color coding as in A.
Figure 4.
Figure 4.
Scatter plots highlighting the interference of a tag sequences with the extension primer in the Gene Flex Tag array. A: Represents successful clustering of one SNP (SNP 1) using ten different tags in a sample from one heterozygous individual. B: The same sample as in A analyzed for SNP 12. The outlier observation on the left of the plot indicates cross-reaction between one tag and the extension primer.

References

    1. Single Nucleotide Polymorphisms for Biomedical Research. The SNP Consortium Ltd. (Deerfield, IL), http://snp.cshl.org/
    1. Cargill M, Altshuler D, Ireland J, Sklar P, Ardlie K, Patil N, Shaw N, Lane CR, Lim EP, Kalyanaraman N, Nemesh J, Ziaugra L, Friedland L, Rolfe A, Warrington J, Lipshutz R, Daley GQ, Lander ES: Characterization of single-nucleotide polymorphisms in coding regions of human genes. Nat Genet 1999, 1999, 22:231-238 - PubMed
    1. Cutler DJ, Zwick ME, Carrasquillo MM, Yohn CT, Tobin KP, Kashuk C, Mathews DJ, Shah NA, Eichler EE, Warrington JA, Chakravarti A: High-throughput variation detection and genotyping using microarrays. Genome Res 2001, 2001, 11:1913-1925 - PMC - PubMed
    1. Chen X, Livak KJ, Kwok PY: A homogeneous, ligase-mediated DNA diagnostic test. Genome Res 1998, 1998, 8:549-556 - PMC - PubMed
    1. Jarvius J, Nilsson M, Landegren U: Oligonucleotide ligation assay. Methods Mol Biol 2003, 2003, 212:215-228 - PubMed

Publication types

LinkOut - more resources