

Revisiting the Ramachandran plot: hard-sphere repulsion, electrostatics, and H-bonding in the alpha-helix
- PMID: 14573863
- PMCID: PMC2366959
- DOI: 10.1110/ps.03235203
Revisiting the Ramachandran plot: hard-sphere repulsion, electrostatics, and H-bonding in the alpha-helix
Abstract
What determines the shape of the allowed regions in the Ramachandran plot? Although Ramachandran explained these regions in terms of 1-4 hard-sphere repulsions, there are discrepancies with the data where, in particular, the alphaR, alphaL, and beta-strand regions are diagonal. The alphaR-region also varies along the alpha-helix where it is constrained at the center and the amino terminus but diffuse at the carboxyl terminus. By analyzing a high-resolution database of protein structures, we find that certain 1-4 hard-sphere repulsions in the standard steric map of Ramachandran do not affect the statistical distributions. By ignoring these steric clashes (NH(i+1) and O(i-1)C), we identify a revised set of steric clashes (CbetaO, O(i-1)N(i+1), CbetaN(i+1), O(i-1)Cbeta, and O(i-1)O) that produce a better match with the data. We also find that the strictly forbidden region in the Ramachandran plot is excluded by multiple steric clashes, whereas the outlier region is excluded by only one significant steric clash. However, steric clashes alone do not account for the diagonal regions. Using electrostatics to analyze the conformational dependence of specific interatomic interactions, we find that the diagonal shape of the alphaR and alphaL-regions also depends on the optimization of the NH(i+1) and O(i-1)C interactions, and the diagonal beta-strand region is due to the alignment of the CO and NH dipoles. Finally, we reproduce the variation of the Ramachandran plot along the alpha-helix in a simple model that uses only H-bonding constraints. This allows us to rationalize the difference between the amino terminus and the carboxyl terminus of the alpha-helix in terms of backbone entropy.
Figures
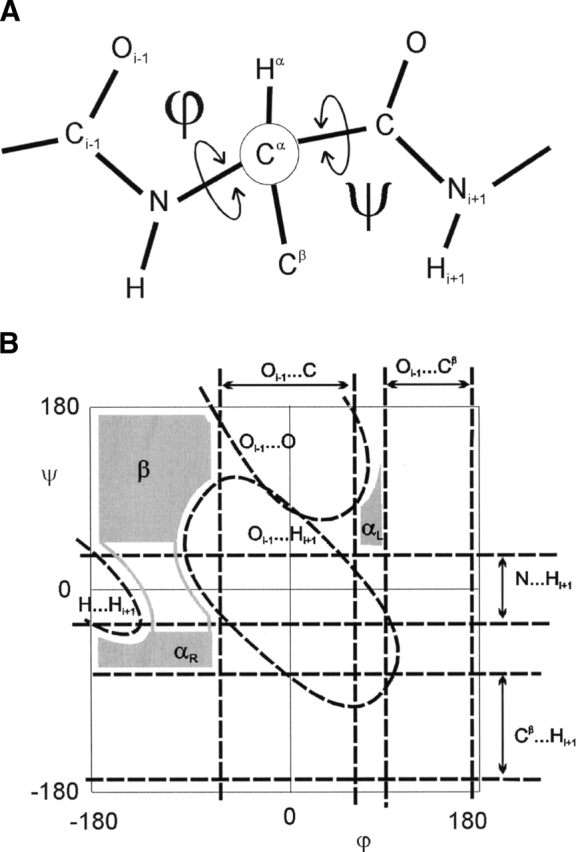
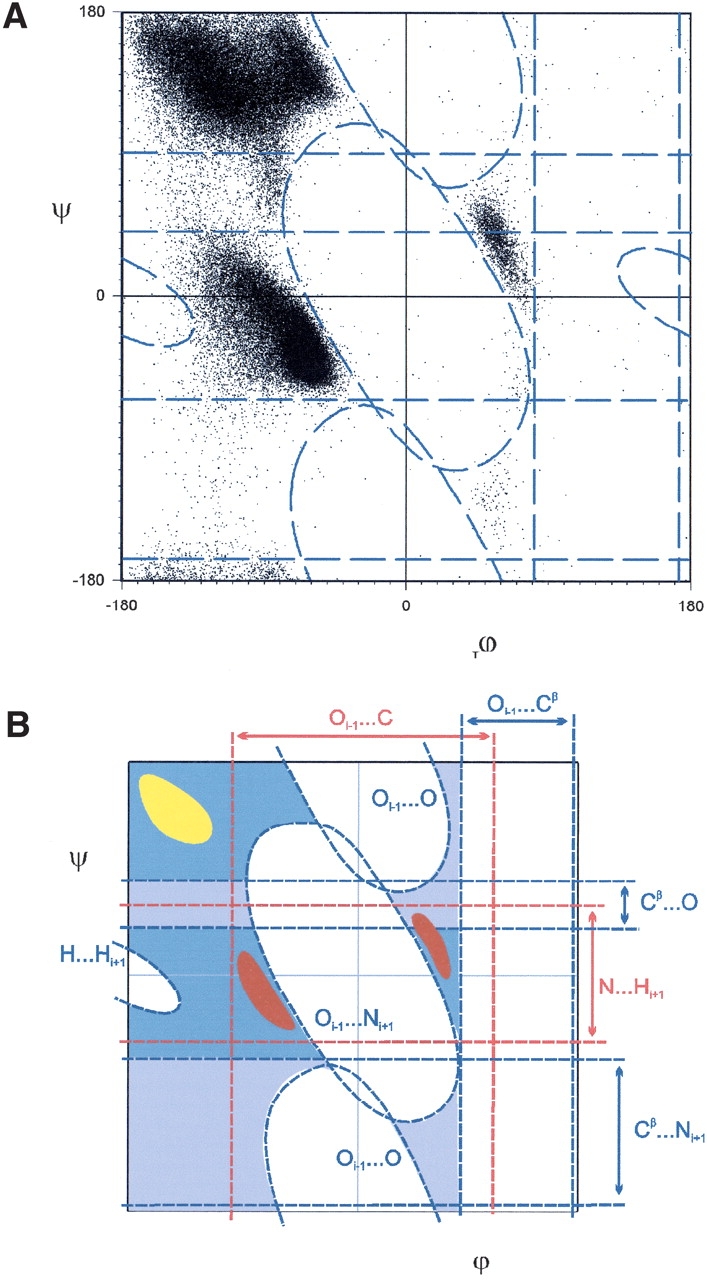
 C-N-C-Cα-C and ψ = N-Cα-C-N dihedral angles. (B) The original Ramachandran steric map (Ramachandran et al. 1963) where the specific hard-sphere repulsions (dashed line) identified by Mandel et al. (1977) define the allowed regions (gray): αL, αR, and β regions.
Similar articles
-
Amino acid conformational preferences and solvation of polar backbone atoms in peptides and proteins.J Mol Biol. 2000 Jul 28;300(5):1335-59. doi: 10.1006/jmbi.2000.3901. J Mol Biol. 2000. PMID: 10903873
-
The Ramachandran plots of glycine and pre-proline.BMC Struct Biol. 2005 Aug 16;5:14. doi: 10.1186/1472-6807-5-14. BMC Struct Biol. 2005. PMID: 16105172 Free PMC article.
-
Revisiting the Ramachandran plot from a new angle.Protein Sci. 2011 Jul;20(7):1166-71. doi: 10.1002/pro.644. Epub 2011 May 31. Protein Sci. 2011. PMID: 21538644 Free PMC article.
-
Sparsely populated residue conformations in protein structures: revisiting "experimental" Ramachandran maps.Proteins. 2014 Jul;82(7):1101-12. doi: 10.1002/prot.24384. Epub 2013 Dec 18. Proteins. 2014. PMID: 23934782 Review.
-
Helix capping.Protein Sci. 1998 Jan;7(1):21-38. doi: 10.1002/pro.5560070103. Protein Sci. 1998. PMID: 9514257 Free PMC article. Review.
Cited by
-
Removal of the Side Chain at the Active-Site Serine by a Glycine Substitution Increases the Stability of a Wide Range of Serine β-Lactamases by Relieving Steric Strain.Biochemistry. 2016 May 3;55(17):2479-90. doi: 10.1021/acs.biochem.6b00056. Epub 2016 Apr 22. Biochemistry. 2016. PMID: 27073009 Free PMC article.
-
Generic coarse-grained model for protein folding and aggregation.J Chem Phys. 2009 Jun 21;130(23):235106. doi: 10.1063/1.3152842. J Chem Phys. 2009. PMID: 19548767 Free PMC article.
-
Structure Motivator: a tool for exploring small three-dimensional elements in proteins.BMC Struct Biol. 2012 Oct 16;12:26. doi: 10.1186/1472-6807-12-26. BMC Struct Biol. 2012. PMID: 23067391 Free PMC article.
-
The characterization of Thermotoga maritima Arginine Binding Protein variants demonstrates that minimal local strains have an important impact on protein stability.Sci Rep. 2019 Apr 29;9(1):6617. doi: 10.1038/s41598-019-43157-y. Sci Rep. 2019. PMID: 31036855 Free PMC article.
-
Order, Disorder, and Temperature-Driven Compaction in a Designed Elastin Protein.J Phys Chem B. 2018 Mar 15;122(10):2725-2736. doi: 10.1021/acs.jpcb.7b11596. Epub 2018 Mar 6. J Phys Chem B. 2018. PMID: 29461832 Free PMC article.
References
-
- Baldwin, R.L. and Rose, G.D. 1999. Is protein folding hierarchic? I. Local structure and peptide folding. Trends Biochem. Sci. 24 26–33. - PubMed
-
- Bernstein, F.C., Koetzle, T.F., Williams, G.J.B., Meyer Jr., E.E., Brice, M.D., Rodgers, J.R., Kennard, O., Shimanouchi, T., and Tasumi, M. 1977. The Protein Data Bank: A computer-based archival file for macromolecular structures. J. Mol. Biol. 112 535–542. - PubMed
-
- Chakrabarti, P. and Pal, D. 2001. The interrelationships of side-chain and main-chain conformations in proteins. Prog. Biophys. Mol. Biol. 76 1–102. - PubMed
-
- Chou, P.Y. and Fasman, G.D. 1974. Conformational parameters for amino acids in helical, β-sheet, and random coil regions calculated from proteins. Biochemistry 13 222–245. - PubMed
Publication types
MeSH terms
Substances
LinkOut - more resources
Full Text Sources
